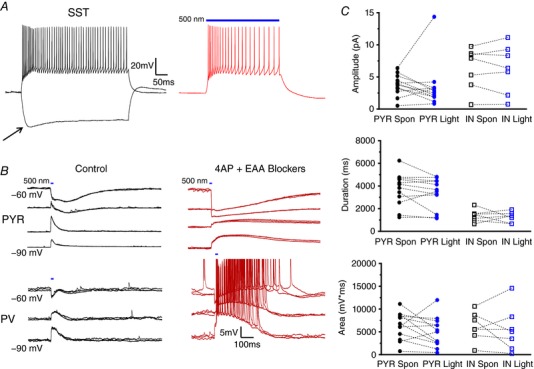
Figure 3. Activation of SST INs is sufficient to initiate LLDs.

A, example traces of SST IN firing properties elicited by current injection (left) or light activation (right). Arrow indicates I h sag typical of SST cells. B, representative traces displaying activity evoked by a 10 ms light pulse in drug‐free aCSF (left) and after 4AP + EAA blockers wash‐on (right). Activity recorded in PYRs (top) and INs (bottom) was similar, although spontaneous APs were more frequently observed in INs. C, quantitative analysis comparing amplitude, duration and AUC of light‐evoked events with those occurring spontaneously. Bars indicate the timing and duration of light pulses. Each symbol represents an individual cell. Error bars are the mean ± SEM. [Color figure can be viewed at wileyonlinelibrary.com]
