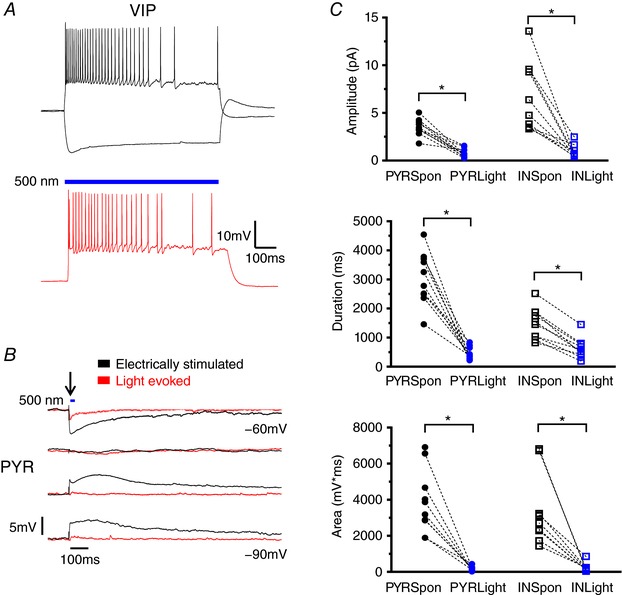
Figure 7. VIP IN activation is not sufficient for the initiation of LLDs.

A, example traces of VIP IN firing properties elicited by current injection (top) or light activation (bottom). B, representative traces comparing electrically evoked activity with activity evoked, at arrow, by a 10 ms light pulse after 4AP + EAA blockers wash‐on in a PYR. Black arrow indicates the time of stimulation. C, the amplitude, duration and AUC of activity evoked by VIP IN activation were significantly smaller than spontaneous LLDs. Blue bars indicate the timing and duration of light pulses. * P < 0.05, Tukey's post hoc test. Each shape represents an individual cell. Error bars are the mean ± SEM. [Color figure can be viewed at wileyonlinelibrary.com]
