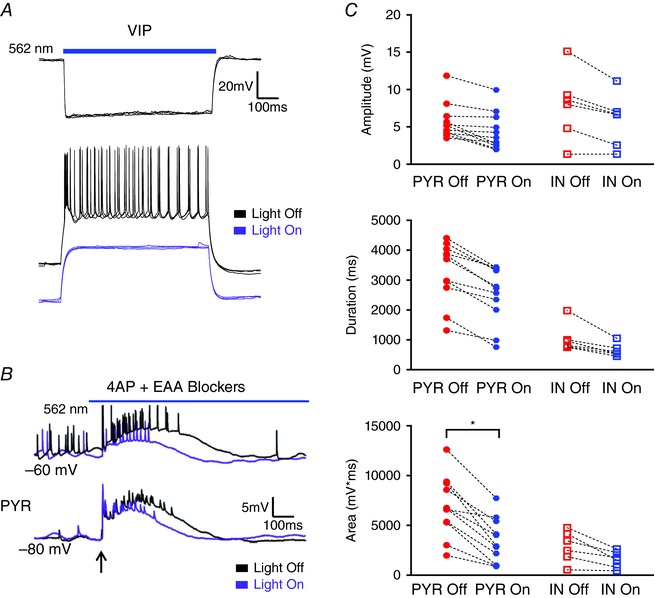
Figure 8. Suppression of VIP IN activity minimally alters evoked LLD magnitude.

A, example traces of membrane hyperpolarization induced by light activation of Arch (top) and superimposed traces showing VIP cell response to a depolarizing current pulse with and without Arch activation (bottom). Light activation hyperpolarized the VIP IN and blocked AP generation. B, superimposed traces from a PYR cell comparing electrically evoked activity recorded with and without concurrent light illumination in the presence of 4AP + EAA blockers. Arrow indicates the time of stimulation. C, light inactivation of VIP INs significantly reduced only the AUC of evoked LLDs in PYRs. * P < 0.05, Tukey's post hoc test test. Blue bars indicate the timing and duration of light pulses. Each shape represents an individual cell. Error bars are the mean ± SEM. [Color figure can be viewed at wileyonlinelibrary.com]
