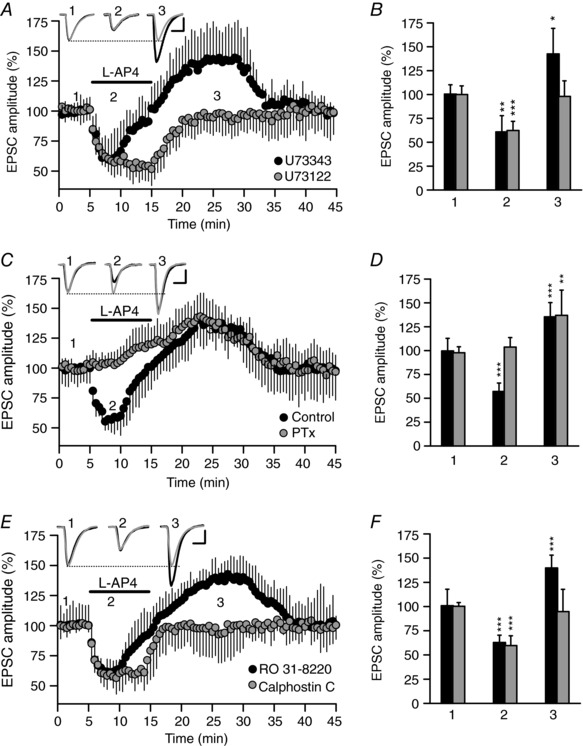
Figure 5. The l‐AP4‐induced potentiation is sensitive to the PLC inhibitor U73122 and to the DAG binding inhibitor calphostin C, but not to pertussis toxin.

A, in the presence of the PLC inhibitor U73122 (2 μm, 30 min), l‐AP4 (500 μm, 10 min) fails to enhance the EPSC amplitude but, rather, it causes sustained inhibition of this parameter. By contrast, the inactive PLC inhibitor U73343 (2 μm, 30 min) caused a transient inhibition that subsequently faded, resulting in the net potentiation of the EPSC amplitude. B, quantification of the changes in EPSC amplitude induced by l‐AP4 (500 μm, 10 min) during inhibition (2) and potentiation (3) in the presence of U73122 (P ˂ 0.0001 and P = 0.7689, n = 6 cells/6 slices/6 mice) or U73343 (P = 0.011 and P = 0.0434, n = 8 cells/8 slices/8 mice). C, in the presence of PTx (2 μg mL−1 for 2–4 h at 30°C), l‐AP4 (500 μm, 10 min) failed to reduce, but rather it enhanced, the EPSC amplitude, whereas in control slices incubated for 2–4 h at 30°C, l‐AP4 (500 μm, 10 min) caused a transient inhibition that subsequently faded into a net potentiation of the EPSC amplitude. D, quantification of the changes in EPSC amplitude induced by l‐AP4 (500 μm, 10 min) during inhibition (2) and potentiation (3) in both PTx treated (P = 0.1709 and P = 0.0048, n = 8 cells/8 slices/8 mice) and in control slices (P ˂ 0.0001 and P = 0.0002, n = 8 cells/8 slices/8 mice). E, in the presence of the DAG binding inhibitor calphostin C (0.1 μm, 30 min), l‐AP4 (500 μm, 10 min) induced sustained inhibition of the EPSC amplitude and it failed to enhance the EPSC amplitude. By contrast, the ATP binding antagonist and PKC inhibitor RO 31‐8220 (1 μm, 30 min) did not alter the l‐AP4 responses, as the transient inhibition was followed by a net potentiation of the EPSC amplitude. F, quantification of the changes in EPSC amplitude induced by l‐AP4 (500 μm, 10 min) during inhibition (2) and potentiation (3) in the presence of calphostin C (P ˂ 0.0001 and P = 0.4741, n = 10 cells/10 slices/10 mice) or RO 31‐8220 (P = 0.0001 and P ˂ 0.0001, n = 9 cells/9 slices/6 mice). In A, C and E, the EPSC sample traces represent the mean of 30 consecutive EPSCs at 0.33 Hz taken 90 s before (1, basal) or 90 s after the addition of l‐AP4 (2, inhibition), and 10 min after l‐AP4 perfusion (3, potentiation). The data were compared to the basal state (1) using an unpaired Student's t test and the values represent the mean ± SD. Scale in A, C and E: 50 pA and 15 ms.
