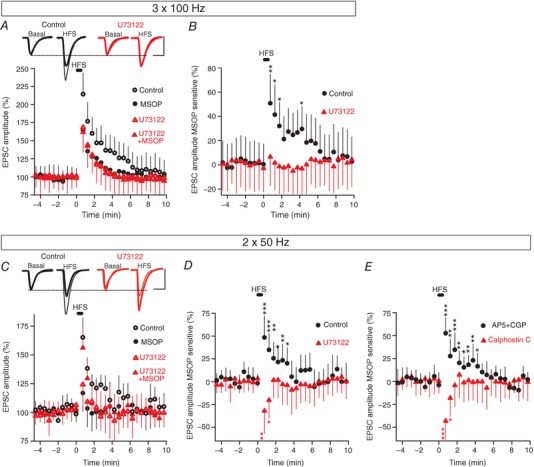
Figure 9. HFS‐induced activation of mGlu7 receptors bidirectionally modulates synaptic transmission, although a potentiating response prevails.

A, changes in EPSC amplitude induced by three trains (1 s at 100 Hz, every 20 s) in control slices (untreated: n = 10 cells/10 slices/5 mice) or in slices exposed to: MSOP (200 μm, 30–60 min, n = 10 cells/10 slices/5 mice), U73122 (2 μm, 30 min, n = 8 cells/8 slices/4 mice), or MSOP plus U73122 (n = 8 cells/8 slices/4 mice). B, quantification of the MSOP sensitive component of the EPSC normalized to the basal values prior to HFS. C, changes in EPSC amplitude induced by two trains (1 s at 50 Hz, every 20 s) in control slices (untreated, n = 9 cells/9 slices/3 mice) or slices exposed to: MSOP (200 μm, 30–60 min, n = 9 cells/9 slices/ 3 mice), U73122 (2 μm, 30 min, n = 9 cells/9 slices/3 mice) or MSOP plus U73122 (n = 9 cells/9 slices/3 mice). D, quantification of the MSOP sensitive component of the EPSC normalized to the basal values prior to HFS. E, quantification of the MSOP sensitive component of the EPSC normalized to the basal values prior to HFS in d‐AP5 (50 μm) plus CGP 55845 (5 μm) treated slices (n = 10 cells/10 slices/3 mice) and in calphostin C (0.1 μm, 30 min) treated slices (n = 10 cells/10 slices/3 mice). Unpaired Student's t test compared to basal values. Scale bars in A and C: 50 pA and 15 ms. EPSC sample traces in A and C represent the mean of 10 consecutive EPSCs at 0.33 Hz 90 s before (basal) and 20 s after HFS. Thin and thick traces indicate in the absence and presence of MSOP, respectively.
