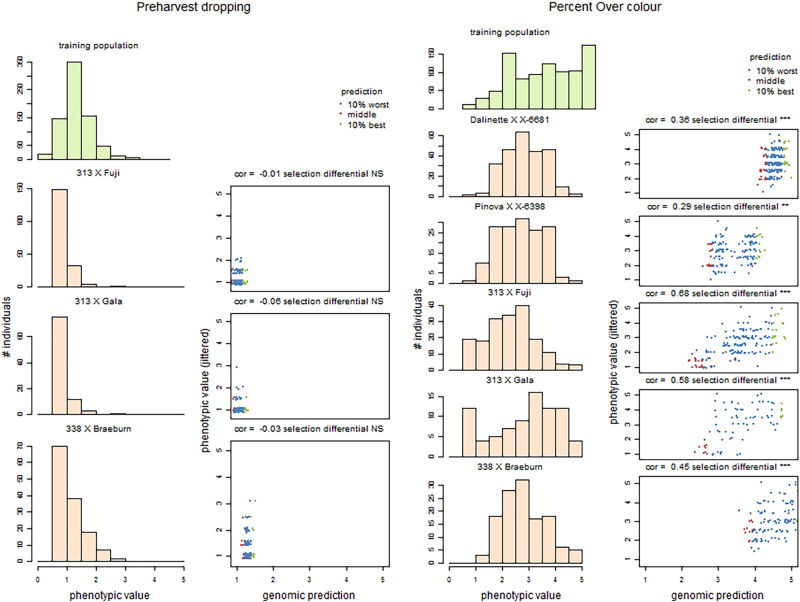
Fig. 4. Within-training population distribution of genotypic BLUP (light green) used for building genome-wide prediction model in apple and within-application family distribution of phenotypic data (means over 2 years, beige) for two traits scored at harvest, Preharvest dropping (first column) and Percent Overcolour (third column).
. Relationship between genomic predictions and phenotypic values for the same traits (Preharvest dropping: second column; Percent Overcolour: fourth column). The 10% (best) individuals with the highest predicted GBV are represented by green points, the 10% (worst) individuals with the lowest predicted GBV by red points, the other individuals by blue points. Accuracies, i.e. correlations between genomic predictions and phenotypic values, are written in the title line, followed by the significance of the difference between the 10% best and worst individuals

