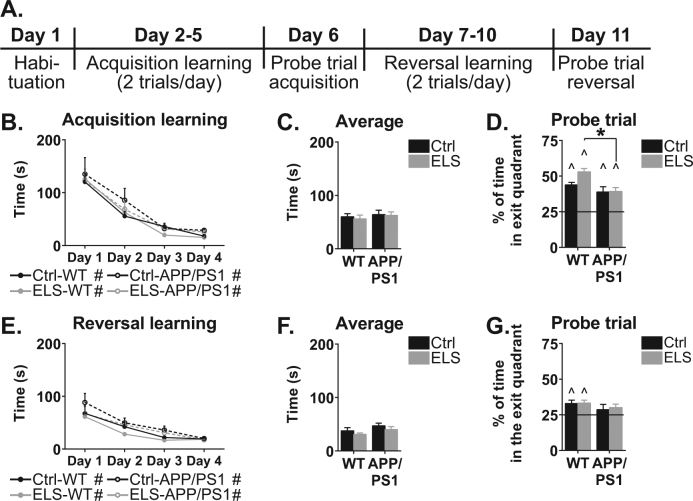
Fig. 2. Barnes maze performance of 6-month-old WT and APPswe/PS1dE9 mice.
a Schematic overview of the experimental design. b Acquisition learning was comparable between all four groups. All groups display a significant learning curve over the trials. c No difference in the average time to find the exit hole. d During the probe trial all groups spend significantly more than 25% of the time in the quadrant where the exit hole was located. ELS-APPswe/PS1dE9 mice spend significantly less time in the exit quadrant than ELS-WT mice. e During reversal learning, all groups show comparable latencies to find the exit hole, and all groups had a significant decrease in latency over the days. f No differences were observed in the average time to find the exit hole. g On the probe trial after reversal learning, only WT mice spend more than 25% of the total time in the exit quadrant. N = 8–12 mice/group. * indicates a significant post hoc Tukey test. # indicates a significant learning curve over the days. ^ indicates significant performance compared to chance level

