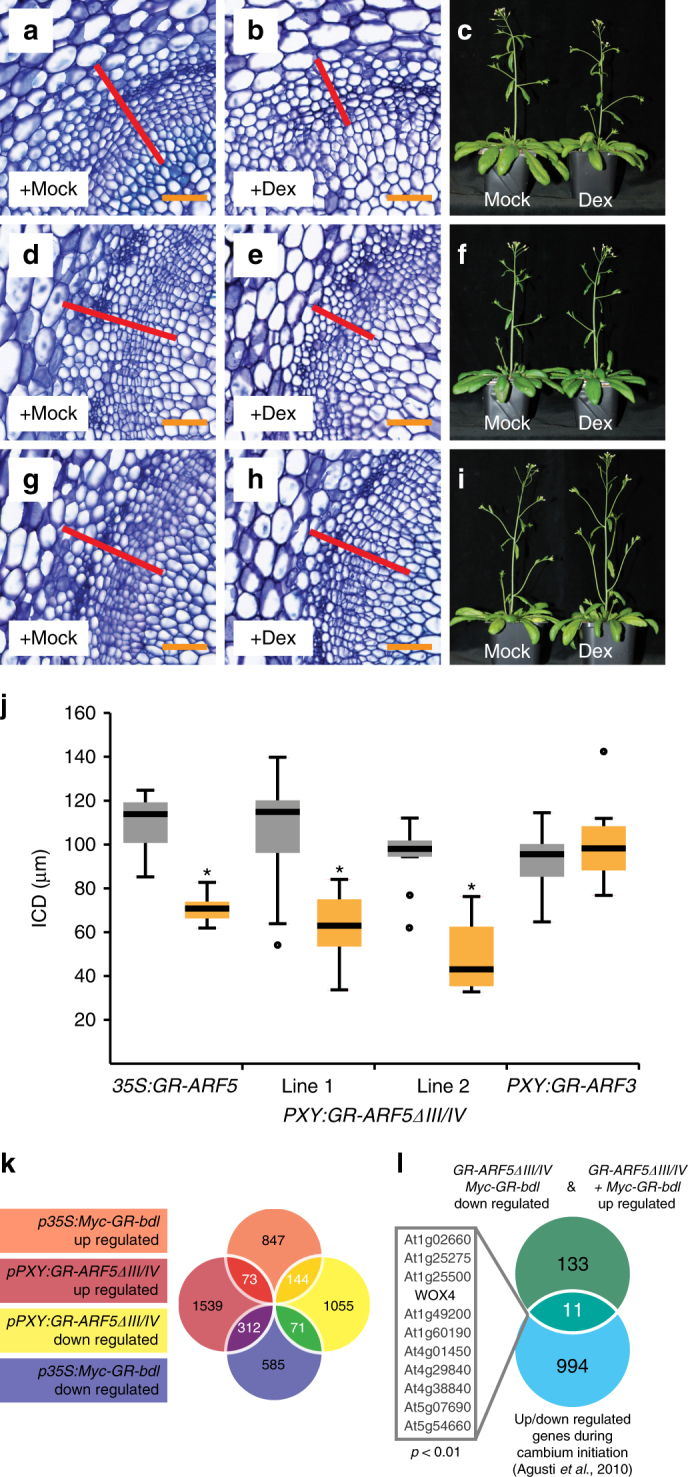
Fig. 4.

ARF5 attenuates cambium proliferation. a, b, d, e, g, h Toluidine blue-stained cross-sections at the stem base of p35S:GR-ARF5 (a, b), pPXY:GR-ARF5∆III/IV (d, e) and pPXY:GR-ARF3 (g, h) plants after long-term mock (a, d, g) or Dex (b, e, h) treatment. Interfascicular regions are shown and ICD tissues are marked (red bar). Size bars represent 50 µm. c, f, i Overview pictures of p35S:GR-ARF5 (c), pPXY:GR-ARF5∆III/IV (f) and pPXY:GR-ARF3 (i) plants after long-term mock or Dex treatment. j Quantification of ICD tissue extension at the stem base of p35S:GR-ARF5, pPXY:GR-ARF5∆III/IV and pPXY:GR-ARF3 plants after long-term mock (grey) or Dex (yellow) treatment. Student’s T-test (p35S:GR-ARF5 p = 3.03E-05, pPXY:GR-ARF5∆III/IV (line 2) p = 1.34E-05, pPXY:GR-ARF3 p = 0.37) and Welch’s T-test (pPXY:GR-ARF5∆III/IV (line 1) p = 9.72E-04) were performed comparing mock and Dex treatment (Sample sizes n = 6–10). The T-bars that extend from the boxes (whiskers) are expected to include 95% of the data. Significance is indicated by the asterisk. k Venn diagram of RNA sequencing results from RNA obtained from second internodes of p35S:Myc-GR-bdl and pPXY-GR-ARF5∆III/IV plants after mock or Dex treatment. Identifiers of 600 overlapping genes are shown in Supplementary Data 1. l Comparison of the 144 unexpectedly acting genes and the group of genes upregulated or downregulated during cambium initiation36. Non-random degree of the overlap was tested by using VirtualPlant 1.3 GeneSect with a cut-off p-value < 0.05 and the Arabidopsis thaliana Columbia (TAIR10) genome as background population
