Fig. 7.

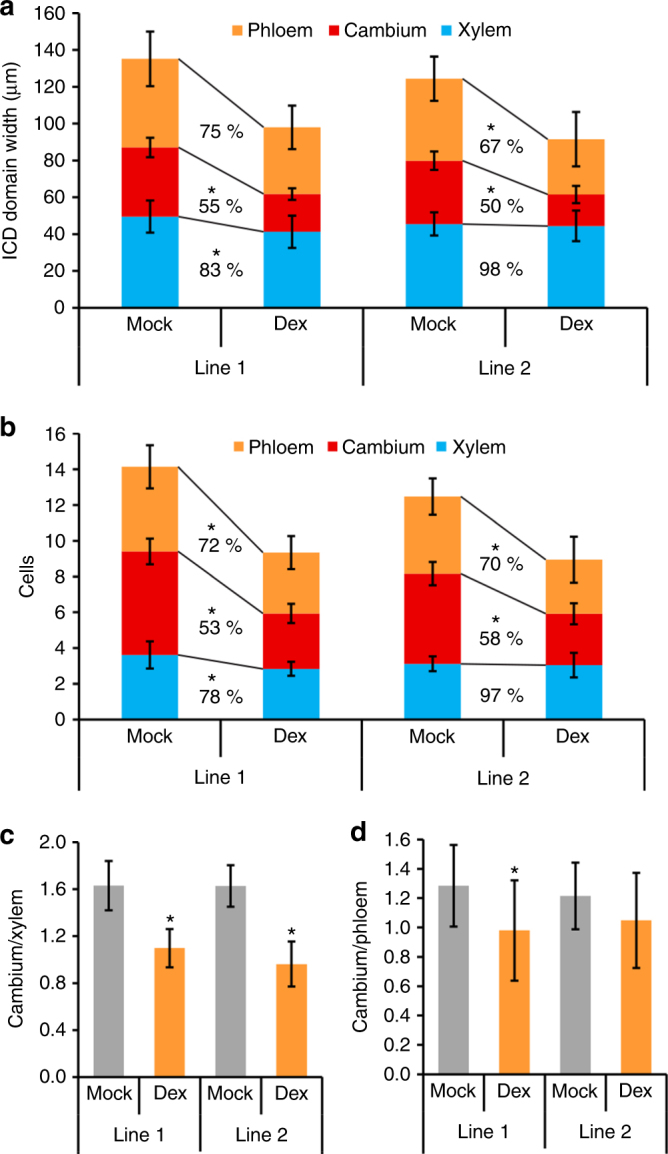
ARF5 predominantly affects the cambium-to-xylem ratio. a Quantification of the width of the vascular tissues phloem (orange), cambium (red) and xylem (blue) and the ICD at the stem base of two mock and Dex-treated pPXY:GR-ARF5∆III/IV lines. Student’s T-test was performed comparing mock and Dex-treated plants (line 1: phloem p = 0.063, cambium p = 6.8E-08, xylem p = 0.49; line 2: phloem p = 0.036, cambium p = 1.28E-06, xylem p = 0.76, sample size n = 8–10). Error bars represent ±standard deviation. Significance is indicated by the asterisk. b Quantification of cell numbers in interfascicular regions. Student’s T-test was performed comparing two mock and Dex-treated pPXY:GR-ARF5∆III/IV lines (line 1: phloem p = 0.013, cambium p = 1.98E-08, xylem p = 0.012; line 2: phloem p = 0.03, cambium p = 1.54E-06, xylem p = 0.79, sample size n = 8–10). Error bars represent ±standard deviation. Significance is indicated by the asterisk. c Ratio of cell numbers in cambium vs. xylem in two mock and Dex-treated pPXY:GR-ARF5∆III/IV lines. Student’s T-test was performed comparing mock and Dex-treated lines (line 1: p = 5.62E-06, line 2: p = 1E-06). Error bars represent ±standard deviation. Significance is indicated by the asterisk. d Ratio of cell numbers in cambium vs. phloem in two mock and Dex-treated pPXY:GR-ARF5∆III/IV lines. Student’s T-test was performed comparing mock and Dex-treated lines (line 1: p = 0.042, line 2: p = 0.22). sample sizes n = 8-10. Error bars represent ±standard deviation. Significance is indicated by asterisks
