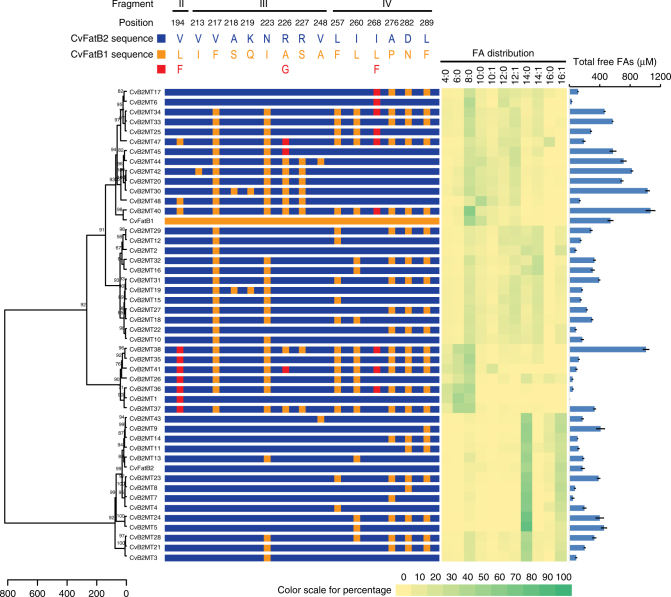
Fig. 2.
Clustering CvFatB2 mutants based on the in vivo FA profiles produced in E. coli. The distance matrix was calculated using Euclidean distances, and Ward’s method was used to perform agglomerative hierarchical clustering. The approximately unbiased (AU) p-values were calculated via multiscale bootstrap resampling with 1000 replicates. The central panel schematically identifies the positions of residues that were mutated in the CvFatB2 sequence (blue colored). The 15 residues that were targeted for mutagenesis are identified and color-coded as either replacement with CvFatB1 residues (orange) or introduction of a residue not found in either CvFatB1 or CvFatB2 (red). The color-coded fatty acid profile is shown on the right side. Major fatty acids produced by each mutant enzyme are highlighted with increasing green coloring (see scale). The graph on the right identifies the total free FAs accumulated in the medium. The data are the average of four replicates, and the error bar represents standard error of the mean

