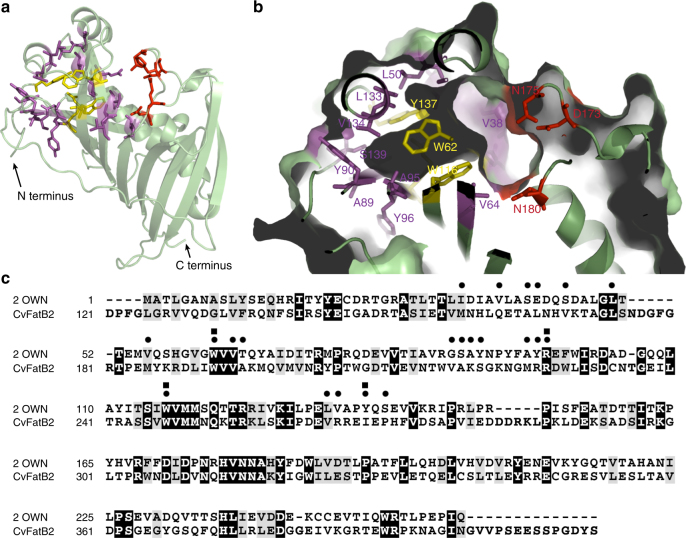
Fig. 4.
Structural analysis of 2OWN and sequence comparison between 2OWN and CvFatB2. a Ribbon diagram of the experimentally determined crystal structure of L. plantarum acyl-ACP TE, 2OWN. Catalytic residues are shown as red stick models. The residues that form the acyl-binding cavity in the N-terminal hotdog domain are shown as magenta and yellow stick models. The four bulky residues that occupy more than 50% of the surface area of the acyl-binding cavity are shown as yellow stick models. b A magnified view of the acyl-binding cavity in the N-terminal hotdog domain. c Sequence comparison of 2OWN and CvFatB2; identical residues are black-shaded, and conservative substitutions are gray-shaded. Residues forming the acyl-binding cavity are indicated by dots above the sequences, and the four bulky residues that account for more than 50% of the surface area of this cavity are indicated by squares above the sequences

