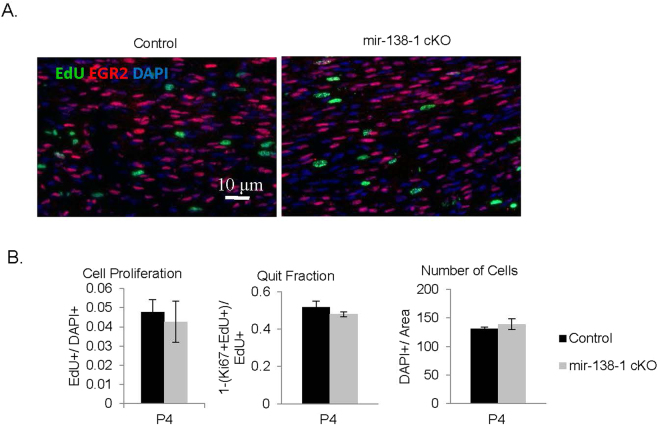
Figure 5.
mir-138-1 cKO sciatic nerves do not display alterations in proliferation, cell cycle exit, and in cell numbers. (A) EdU (green), EGR2 (red) and DAPI (blue) staining of P4 mutant and control sciatic nerves. (B) Quantification of EGR2 expression (EGR2+/DAPI+) and cell proliferation rate (EdU+/DAPI+) in P4, and quit fraction (Ki67-EdU+/EdU+) and cell numbers (DAPI+/area) in P4 mutant and control sciatic nerves. There is no significant difference detected in the number of EGR2-expressing cells (N ≥ 4; P4, p = 0.7847), cell proliferation rate (N ≥ 4; P4, p = 0.6942), quit fraction (N ≥ 4; P4, p = 0.1500), or cell number per unit area (N ≥ 4; P4, p = 0.4910). Black bar = controls. Gray bar = mir-138-1 cKOs.

