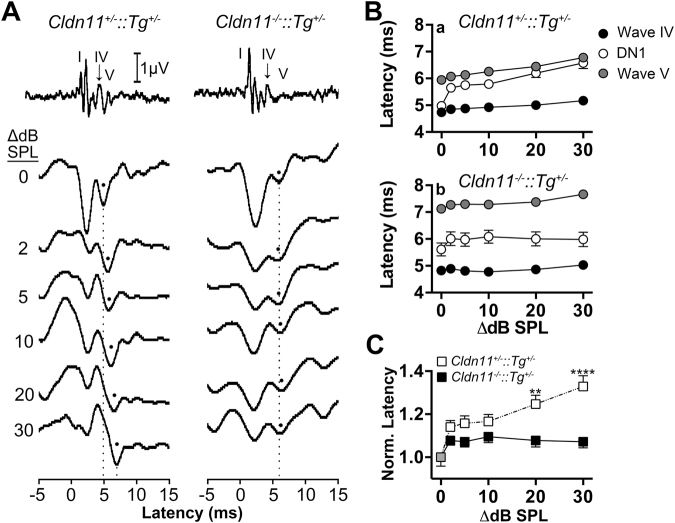
Figure 6.
Cldn11−/−::Tg+/− mice exhibit abnormal sound lateralization. (A) Representative binaural interaction component (BIC) traces from Cldn11+/−::Tg+/− and Cldn11−/−::Tg+/− mice calculated for stimulus intensity differences between each ear of 0–30 dB SPL. Black dots identify the processed binaural output from those intensity differences, which are the DN1 troughs. Monaural ABR traces (top) are in temporal alignment with the BICs to highlight the latency of the processed binaural DN1 trough, which occurs between monaural evoked latencies of waves IV and V. Dashed lines highlight the latency of DN1 for Cldn11+/−::Tg+/− mice as sound is lateralized (Δ0 to Δ30 dB SPL respectively) and draw attention to the lack of shift in Cldn11−/−::Tg+/− mice. (B) Latency/intensity series comparing latency of ABR waves IV (black circles) and V (grey circles) to the calculated DN1 trough (white circles) for (Ba) Cldn11+/−::Tg+/− and (Bb) Cldn11−/−::Tg+/− mice. Note the pathological increased wave V latency for Cldn11−/−::Tg+/− mice. (C) Comparison of DN1 trough latencies for Cldn11+/−::Tg+/− and Cldn11−/−::Tg+/− mice. Lateralized DN1 trough latencies (Δ2–30 dB SPL) were normalized to the midline response latency (Δ0 dB SPL) for each animal. As sound is lateralized, the DN1 interaction trough latency is significantly different between Cldn11+/−::Tg+/− and Cldn11−/−::Tg+/− mice [F(1,20) = 10.3, p = 0.005]. Grey circles represent the normalized value for both Cldn11+/−::Tg+/− and Cldn11−/−::Tg+/− mice. Data plotted as mean ± SEM; 10 ≤ n ≤ 12; **p < 0.01, ****p < 0.0001.

