
Figure 2.
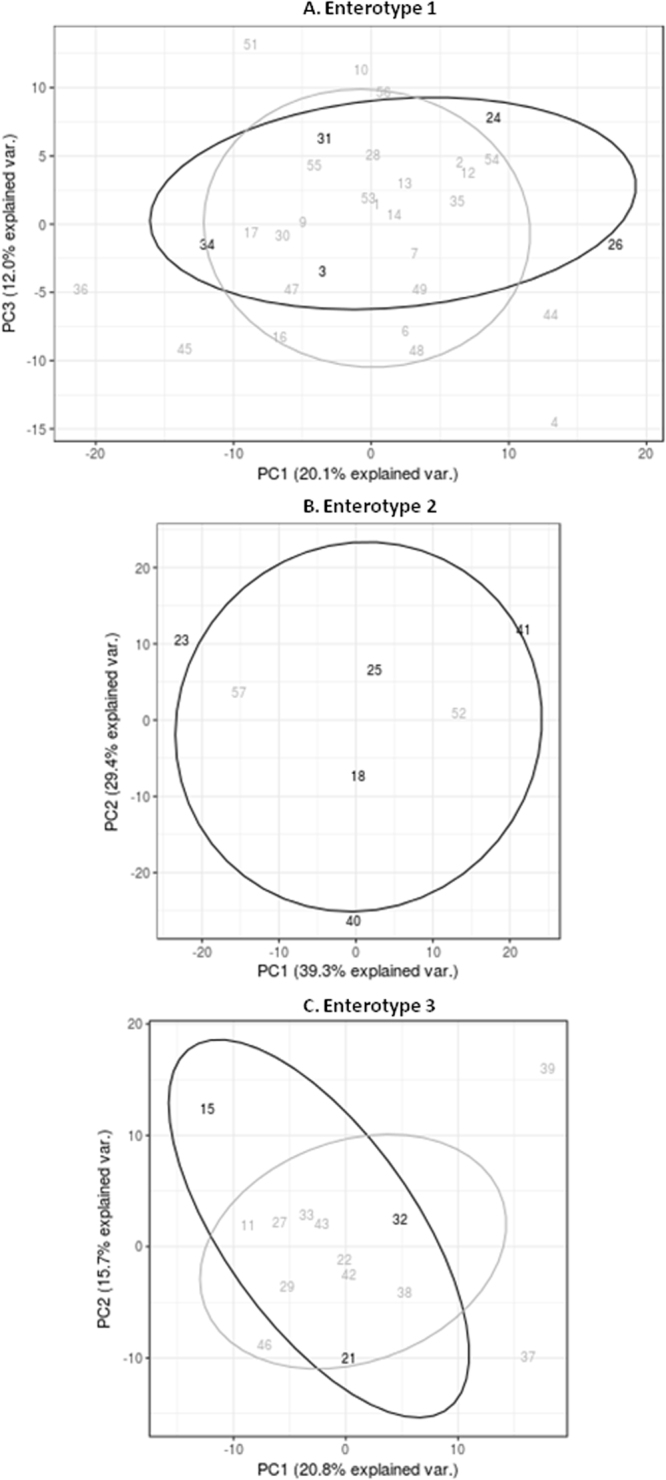
Principal Component Analysis of the microbiome composition comparing the variability of the intestinal bacteria composition of patients that undergone BT (in black) and with those that do not have bacterial translocation (in grey), differentiating between the three enterotypes, Ent1 (A), Ent2 (B) and Ent3 (C). This statistical analysis was performed using R package version 3.2.3, comparing the bacteria composition at the genera taxonomical level for each patient in order to look for groups of genera that can allow grouping samples based on the variability found. When comparing patients belonging to Ent1, PC1, or Principal Component 1, explained the 20.1% of the total variability found, and PC2 or Principal Component 2, explained the 12.0% of the total variability. Taken into account those that are associated to Ent2, PC1, or Principal Component 1, explained the 39.3% of the total variability found, and PC2 or Principal Component 2, explained the 29.4% of the total variability, where as those belonging to Ent3, PC1, or Principal Component 1, explained the 20.8% of the total variability found, and PC2 or Principal Component 2, explained the 15.7% of the total variability.