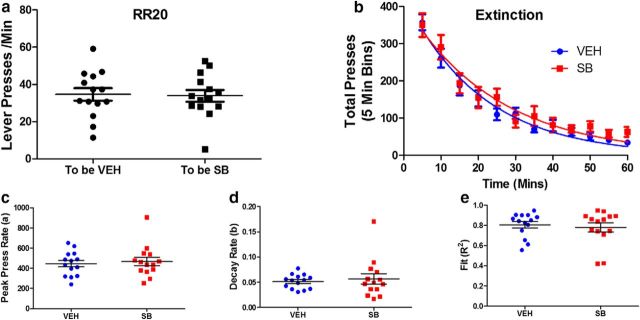
Figure 5.
SB242084-enhanced goal-directed activity is not due to an increased resistance to extinction. a, Lever press rates during the RR20 session before the extinction test in groups assigned to either vehicle (Veh) or SB treatment. b, Total lever presses in 5 min bins during the extinction session. Lines indicate nonlinear fit of the group mean data to the exponential decay function: Y = (a × exp (−b × x). c, Peak press rate (a) during the extinction session. d, Rate of decay (b) during extinction. e, Goodness of fit (R2) during the extinction session. a, c–e, Symbols indicate individual subject's data, lines indicate group mean, and error bars indicate SEM. N = 14 mice per group.

