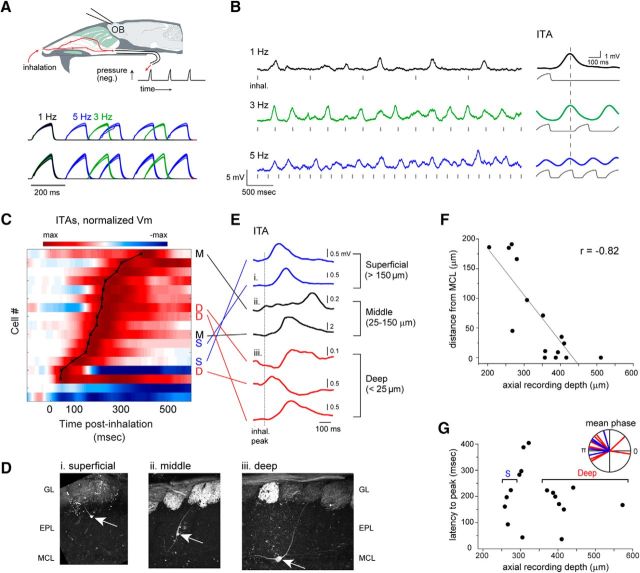
Figure 1.
Inhalation-linked modulation of membrane potential in a fraction of MT cells. A, Schematic of artificial inhalation paradigm. Negative pressure transients were applied to the nasopharynx while performing whole-cell recordings from OB neurons. Traces represent pressure transients measured in parallel with each recording, delivered at 1, 3, and 5 Hz, from two different recordings. Negative pressure (inhalation) is upward. Each set of traces includes overlays of 18–29 trials. B, Vm traces from a superficial MT cell (shown in D) during inhalation at 1, 3, and 5 Hz. Hash marks indicate onset of each inhalation, for visual reference. The ITA Vm response to repeated inhalations at each frequency is shown to the right of each trace, along with the simultaneously measured pressure transient (gray). Vertical dashed line indicates time of peak ITA depolarization at 1 Hz for comparison across frequencies. C, Pseudocolor representation of ITAs for all recorded cells showing significant Vm modulation by 1 Hz inhalation (17 of 36 total cells). Cells are ordered in rows and sorted in order of latency to peak depolarization, indicated by overlaid black plot. Pseudocolor range is set to twice the maximum absolute deviation from baseline Vm (max to −max), normalized separately for each ITA, and displayed in 0.1 ms time-bins. Time 0 indicates the time of peak negative pressure, which is 150 ms after inhalation onset. Morphologically identified cells (defined as in D–F) are labeled as deep (D), middle (M), or superficial (S) to the right of their corresponding row. D, Examples of superficial, middle, and deep MT cells after partial morphological recovery. Arrows indicate soma, with primary dendrite extending into a glomerulus. GL, Glomerular layer; EPL, external plexiform layer; MCL, mitral cell layer. Fluorescence in glomeruli is from synaptopHluorin expressed in OSNs in omp-spH mice. E, ITA Vm traces for each of the 7 identified cells in C, classified by depth from superficial to deep. Traces begin at inhalation onset. Dashed line indicates time of peak inhalation (corresponding to t = 0 in C). F, Plot of soma position relative to MCL versus axial depth of the recording pipette for all filled cells. Line indicates linear fit to data. G, Latency to peak depolarization for all inhalation-modulated cells, measured from the ITA at 1 Hz and plotted as a function of recording depth. Brackets indicate depth range used to classify MT cells as deep or superficial (deep, >350 μm; superficial, <275 μm). Inset, Vectors representing the mean phase of the Vm ITA with respect to the inhalation cycle from superficial (blue, n = 5) and deep (red, n = 11) MT cells significantly modulated by 1 Hz respiration (p < 0.05, Rayleigh's test).

