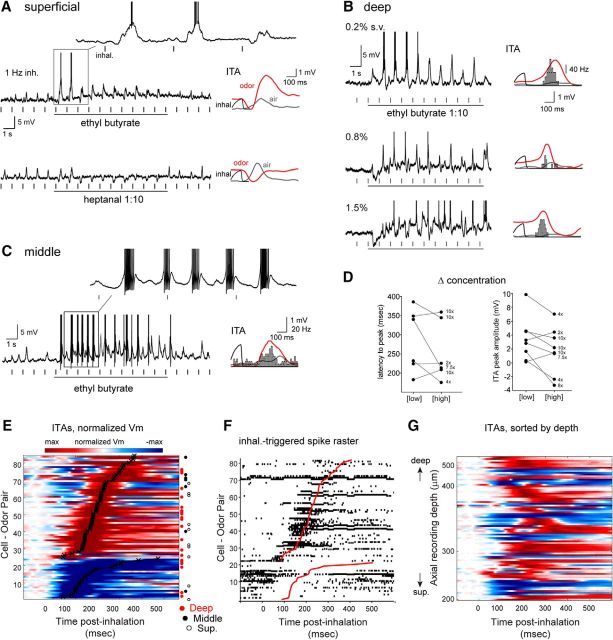
Figure 2.
Diverse inhalation-linked temporal patterning of odorant-evoked responses. A–C, Examples from three filled MT cells showing diverse responses to odorant at 1 Hz inhalation. Raw Vm traces represent response to a single, 10 s odorant presentation. Plots at right represent ITA during odorant inhalation (red) compared with ITA of ambient air before odorant presentation (gray). ITAs include spike histograms (bins, 10 ms), generated from seconds 3–10 of stimulation. A, Distinct response patterns to two different odorants in a superficial MT cell (same cell as in Fig. 1B). B, Progression of inhalation-driven Vm and spiking response patterns with increasing odorant concentration in a deep MT cell. C, Entrainment of odorant-evoked spike bursts to inhalation in a middle MT cell. D, Plot of ITA latency, measured as time-to-peak (left) and amplitude (right) as a function of odorant concentration. Connected points indicate values for the same MT cell tested at a low or high concentration; numbers to the right of each high concentration point indicate relative increase in concentration. Latency values were measured for depolarizing ITAs only (6 cell-odor pairs); amplitude values were measured for either polarity and so included two additional cell-odor pairs (from 6 MT cells total). E, Pseudocolored time course of odorant-evoked ITA for all significantly modulated cell-odor pairs (82 of 90), sorted by latency to peak depolarization or hyperpolarization (lower rows) as indicated by black plot. Approximately 30% of cells show a predominately hyperpolarizing response. Rows corresponding to filled superficial (S, open circle), middle (M, filled circle), or deep (D, red circle) cell-odor pairs are indicated to the right of each row. Time 0 indicates time of peak inhalation. F, Inhalation-linked spike rasters for the same cell-odor pairs as in E, sorted as in E. Rasters are compiled across trials. G, Same Vm ITAs as in E, sorted by axial recording depth instead of latency. There is no clear progression of ITA temporal patterns from superficial to deep recordings.

