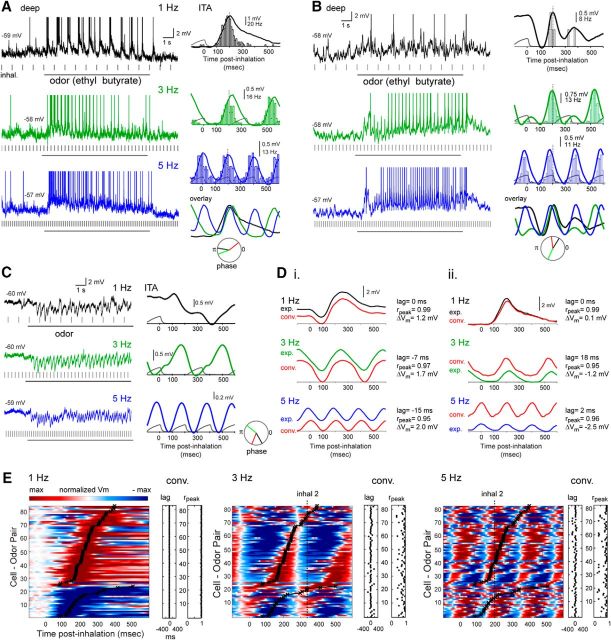
Figure 3.
Inhalation-linked temporal patterning of odorant responses persists across frequency. A, Raw Vm traces (left) and odorant-evoked ITA of Vm and spiking (right) for a deep MT cell during 1, 3, and 5 Hz inhalations. Depolarization and spike burst duration shortens at higher sniff frequencies, but peak time remains consistent. Dashed line indicates time of peak depolarization in the 1 Hz ITA, for comparison across frequencies. ITAs for each frequency are overlaid at lower right for visual comparison. Circular plot represents phase of ITA for each frequency. B, Second example showing odorant-evoked ITA of Vm and spiking for a deep MT cell during 1, 3, and 5 Hz inhalations, with a biphasic hyperpolarization/depolarization sequence morphing to a simple sinusoidal modulation at 3 and 5 Hz, along with an emergence of spiking. C, Raw Vm traces (left) and ITA (right) from a deep MT cell showing the emergence of sinusoidal inhalation-linked patterning of Vm from a purely hyperpolarizing response to odorant inhalation at 1 Hz. D, Comparison of recorded (exp.) and predicted (red, conv.) Vm ITAs for two cells. Di, ITA taken from MT cell in Fig 2A. Dii, ITA taken from MT cell in panel A. Predicted ITAs were generated from convolution of the recorded 1 Hz ITAs with the inhalation event times at 1, 3, and 5 Hz. In both cells, ITA shape is similar for recorded and predicted traces, but convolution does not predict mean Vm well, with ΔVm increasing in magnitude at higher frequencies and varying in polarity for both cells. E, Pseudocolor plots of odorant-evoked Vm ITAs for all responsive cell-odor pairs at 1, 3, and 5 Hz, sorted by latency to peak depolarization or hyperpolarization at 1 Hz. The 1 Hz plot is identical to that from Figure 2D. Black plot overlay represents peak time for 1 Hz inhalation, for comparison across frequencies. ITAs are low-pass filtered at 50 Hz, then scaled as in previous figures (max to −max deviation from baseline) with baseline set to the mean preinhalation Vm. ITAs at each frequency were scaled independently. Dashed vertical line (inhal 2) indicates peak time of next inhalation. At 5 Hz, in ∼50% of cells, depolarization begins after the next inhalation has occurred. The lag and rpeak values comparing the recorded and convolved (predicted) ITA for each cell-odor pair are shown to the right of each pseudocolor plot, with each point corresponding to the same cell-odor pair to its left.

