Figure 6.

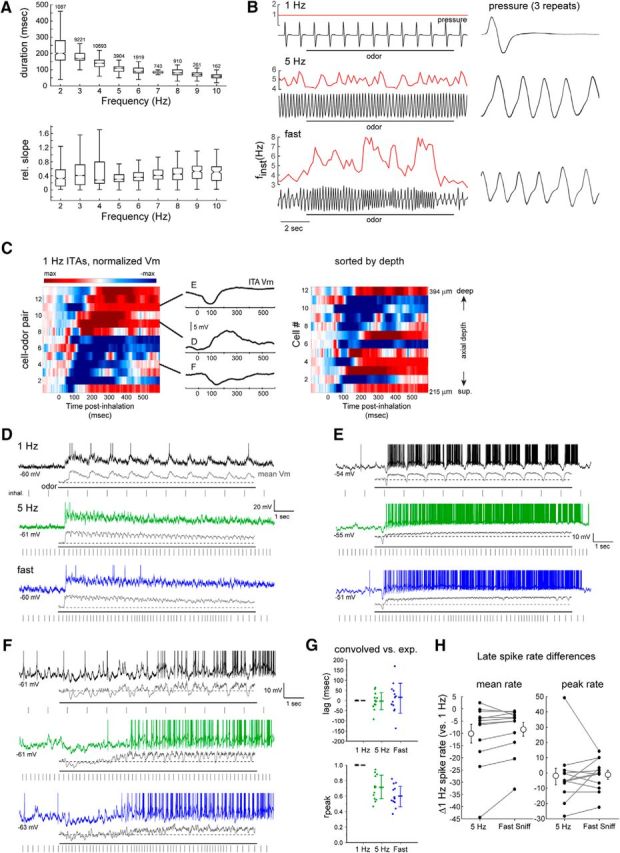
Heterogeneous effects of sniff frequency on MT cell excitability persist during playback of naturalistic active sniffing. A, Analysis of inhalation duration (top) and onset slope (bottom) as a function of instantaneous sniff frequency, measured from awake, head-fixed mice. Box-and-whisker plots show median, first and third quartiles of duration or onset slope, and 1.5 times the interquartile range for each frequency bin. Number of sniffs measured is shown for each bin. B, Pressure waveforms used for the sniff playback recordings, with instantaneous frequency (finst) shown for the two active-sniff waveforms (5 Hz) and (fast sniff). Black trace represents pressure output from the sniff playback device; instantaneous frequency is shown in red above each trace. Right, Expanded view of a portion of the playback pressure, repeated three times for each playback trace and overlaid. Inhalation is up in all cases. C, Left, Pseudocolored time course of odorant-evoked ITA for 13 cell-odor pairs using playback of the 1 Hz sniff, aligned to inhalation peak. Middle, ITA traces for the three example cells shown in D–F, plotted relative to the time of peak inhalation. Right, Same ITAs for unique cells (n = 12), sorted by recording depth; numbers indicate vertical pipette depth from dorsal bulb surface. D–F, Example traces showing responses in three MT cells to playback of the 1 Hz, 5 Hz, and fast sniff waveforms. For each frequency, top trace represents raw Vm (with spikes clipped), with the mean spike-filtered Vm averaged from 3 to 5 repeated trials shown below. Rasters below each trace indicate inhalation peak times. G, Comparison of lag (top) and rpeak (bottom) values comparing the recorded and convolved (predicted) ITAs for all cells for 1 Hz, 5 Hz, and fast sniff playback traces. Each point is one cell; mean and SD are shown to the right of data points. H, Diverse effects of sustained odorant sampling during active sniffing frequencies, compared with 1 Hz sniffing across individual MT cell-odor pairs. Plots represent difference in mean (left) or peak (right) spike rate in the “late” period of the response (8–9 s after start of odorant presentation), relative to that at 1 Hz for each cell-odor pair, for the 5 Hz and fast sniff playback traces. There is high variance from 1 Hz rates. Gray lines connect points from the same cell-odor pair. Error bars indicate SD.
