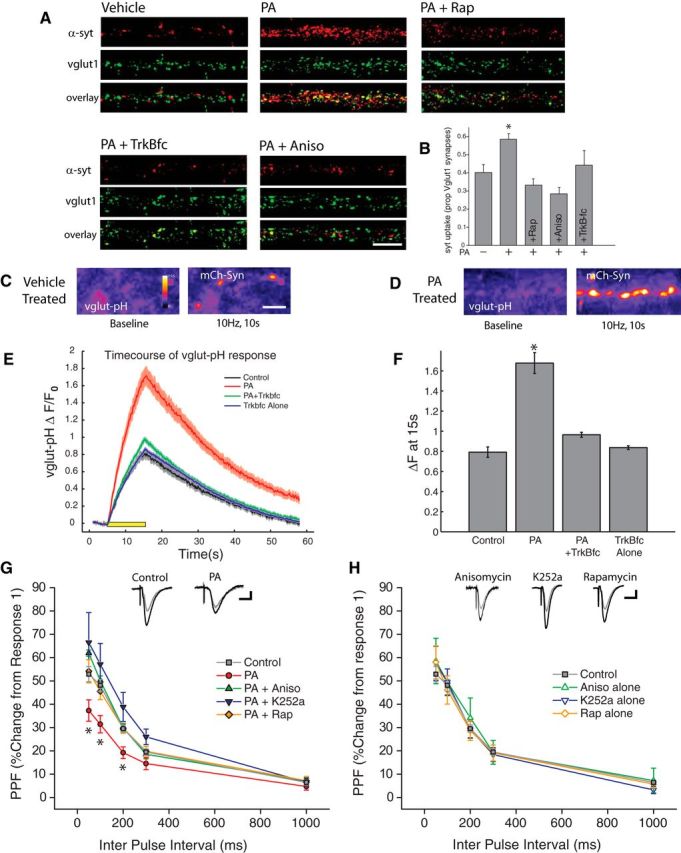
Figure 7.

Enhanced presynaptic release emerges quickly after mTORC1 activation. A, B, Representative examples (A) and mean (+ SEM) syt-lum uptake (B) from experiments where the indicated groups were treated with PA (100 μm, 90 min) in the presence or absence of rapamycin (200 nm, 30 min prior), anisomycin (40 μm, 30 min prior) or TrkB-Fc (1 μg/ml, 30 min prior). Sample sizes for the indicated groups: vehicle control (n = 52 images), PA alone (n = 91 images), PA+rapamycin (n = 34 images), PA+anisomycin (n = 41 images), or PA+TrkB-Fc (n = 30 images images). PA treatment induced a significant (*p < 0.05, relative to vehicle control) increase in syt-lum uptake that was blocked by inhibiting protein synthesis, mTORC1, or by scavenging extracellular BDNF. Scale bar represents 10 μm in A. C, D, Example images of synapses expressing vglut1-pHluorin (vglut-pH) at baseline (left panel) as well as immediately after termination of a 10 Hz, 10 s stimulus train (right panel) for vehicle treated control (C) as well and neurons treated with PA (D). Treatment with phosphatidic acid enhanced the changes in vglut-pHluorin fluorescence intensity, compared with cells treated with vehicle in response to an identical stimulus train. Scale bar represents 10 mm in (C). E, Time course of relative change in vglut-pHluorin fluorescence in response to a 10 Hz 10 s stimulus train, recorded from cells treated with vehicle, PA, TrkB-fc or TrkBfc + PA. Black bar represents onset of 10 s stimulus train. Gray: Vehicle control (n = 566 synapses). Red: PA (n = 802 synapses). Green: PA+TrkB-fc (n = 652 synapses). Blue: TrkB-fc alone (n = 750 synapses). F, Mean (± SEM) change in vlgut-pHluorin fluorescence intensity from baseline recorded at the termination of a 10 Hz, 10 s AP train evoked by field stimulus. Evoked changes in vglut-pHluorin fluorescence intensity were significantly enhanced by treatment with PA, and this effect was blocked by pretreatment with the BDNF scavenger TrkB-fc. (*p < 0.05, one-way ANOVA, Tukey–Kramer post hoc). G, H, Paired-pulse facilitation (PPF) in acute hippocampal slices. Treatment with phosphatidic acid (100 μm, 45 min) significantly diminished (*p < 0.05, relative to vehicle controls) the degree of facilitation induced by paired pulses at 50, 100 and 200 ms intervals. Pretreatment with anisomycin, rapamycin, as well as the Trk receptor antagonist K252a, blocked this effect. H, Inhibitors have no effect on their own relative to vehicle-treated controls. Gray Circles: Control (n = 38 slices); Red Circles: PA (n = 10); Green closed Triangles: PA+Aniso (n = 7 slices); Blue closed triangles: PA+ K252a (n = 8 slices); Orange closed diamonds: PA+ Rap (n = 6 slices); Green open Triangles: Aniso Alone (n = 3 slices); Blue open Triangles: K252a alone (n = 9 slices); Orange open Diamonds: Rap alone (n = 8 slices). Scale bar represents 10 ms and 100 mV.
