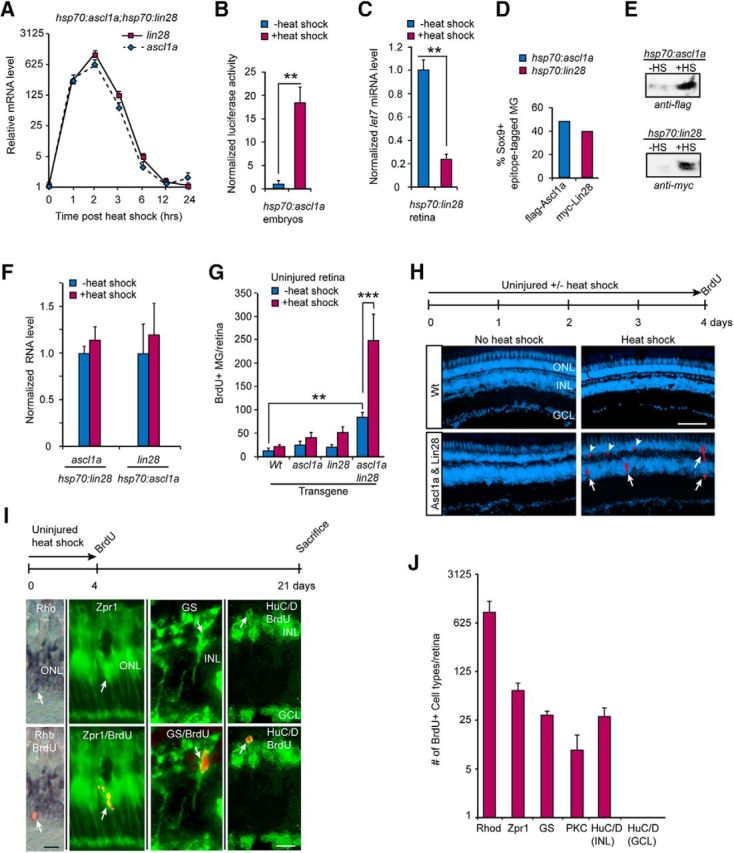
Figure 1.

Forced expression of Ascl1a and Lin28a stimulates MG proliferation and neuron regeneration in the uninjured retina. A, Time course of ascl1a and lin28a RNA expression in retinas of hsp70:ascl1a;hsp70:lin28a transgenic fish that received a 1 h heat shock; n = 3 different experiments. Error bars are SD. B, Luciferase assays show heat shock of hsp70:ascl1a embryos injected with 4RTK-Luc plasmid results in increased expression of the 4RTK-Luc reporter indicating expression of a functional Ascl1a protein; n = 3 different experiments. Error bars are SD. **p < 0.009. C, Heat shock-dependent induction of Lin28a in hsp70:lin28a adult fish results in reduced let7g miRNA expression indicating expression of a functional Lin28a protein; n = 3 different experiments. Error bars are SD. **p < 0.01. D, Immunofluorescence quantification of the percentage of Sox9+ MG-expressing flag-Ascl1a and myc-Lin28a 8 h after a 1 h heat shock in hsp70:ascl1a and hsp70:lin28a transgenic fish. E, Western blot analysis showing flag-Ascl1a and myc-Lin28a protein induction 8 h after a 1 h heat shock in hsp70:ascl1a and hsp70:lin28a transgenic fish. F, Forced expression of Lin28a in hsp70:lin28a does not stimulate ascl1a expression and forced expression of Ascl1a in hsp70:ascl1a fish does not induce lin28a RNA expression. G, BrdU immunofluorescence on retinal sections was used to quantify proliferating MG in the INL of uninjured retinas from transgenic fish expressing the indicated transgenes for 4 d; n = 3 different experiments. Error bars are SD. **p < 0.01, ***p < 0.001. H, Timeline of experiment and representative retinal sections showing BrdU immunofluorescence (red) before and after heat shock in Wt and hsp70:ascl1a;hsp70:lin28a transgenic fish. DAPI nuclear stained cells are blue. Scale bar, 100 μm. I, Timeline of lineage trace experiment and representative retinal sections showing colocalization of either rod rhodopsin (Rho) photoreceptor in situ hybridization signal (left, blue), cone (Zpr1), MG (GS), or amacrine cell (HuC/D in INL) immunofluorescence signal (green), with BrdU immunofluorescence signal (red). Scale bar, 20 μm. J, Quantification of data presented in I; bipolar cells (protein kinase C, PKC); n = 3 different experiments. Error bars are SD.
