
Figure 1.
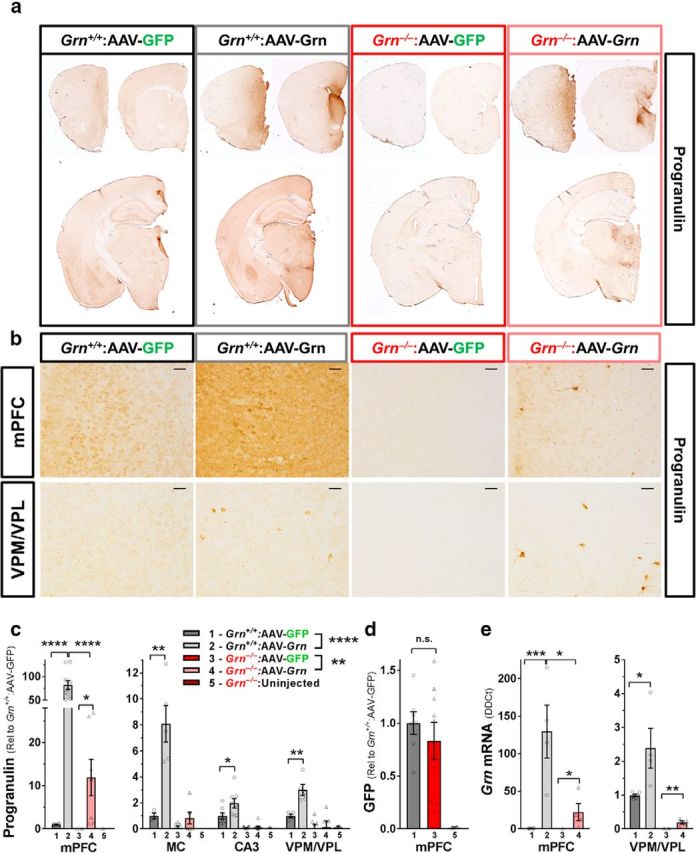
AAV-Grn transduced many cells in the mPFC, but also transduced small numbers of cells throughout the forebrain. a, Immunostaining for progranulin revealed strong increases in progranulin immunoreactivity in the mPFC, with smaller increases in the septum, striatum, and thalamus of mice treated with AAV-Grn. b, Higher-magnification (20×) images of progranulin immunostaining revealed large numbers of strongly progranulin-immunoreactive cells in the mPFC of both wild-type and Grn−/− mice treated with AAV-Grn, with smaller numbers of strongly progranulin-immunoreactive cells in regions away from the injection site such as the VPM/VPL thalamus. c, Progranulin protein levels as measured by ELISA were increased in AAV-Grn-treated wild-type (****p < 0.0001, ANOVA, effect of virus, F(1,40) = 28.57) and Grn−/− mice (**p = 0.0043, ANOVA, effect of virus, F(1,51) = 9.707) relative to their GFP-treated controls, with the highest progranulin expression in the mPFC. In addition, wild-type mice exhibited significantly higher progranulin overexpression in the mPFC than Grn−/− mice (t test, t(15) = 6.034, p < 0.0001; n = 3–11 mice per group. *p < 0.05, **p < 0.01, and ****p < 0.0001, t test). d, In contrast, we did not observe a significant genotype difference in expression of GFP in AAV-GFP-treated wild-type and Grn−/− mice by Western blot (p = 0.4629, t test). e, AAV-Grn also increased Grn RNA levels in the mPFC (ANOVA: effect of virus, F(1,14) = 21.26, p = 0.0004) and VPM/VPL thalamus (ANOVA: effect of virus, F(1,16) = 11.38, p = 0.0039). In both brain regions, wild-type AAV-Grn-treated mice had significantly higher Grn RNA levels than AAV-Grn-treated Grn−/− mice (mPFC ANOVA: effect of genotype, F(1,14) = 10.87, p = 0.0053, genotype × virus, F(1,14) = 10.59, p = 0.0058, VPM/VPL ANOVA: effect of genotype, F(1,16) = 46.09, p < 0.0001, genotype × virus, F(1,16) = 6.622, p = 0.0204). n = 4–6 mice per group; *p < 0.05, **p < 0.01, and ***p < 0.001, t test). Representative 20× images in b are shown with 50 μm scale bars.