
Figure 5.
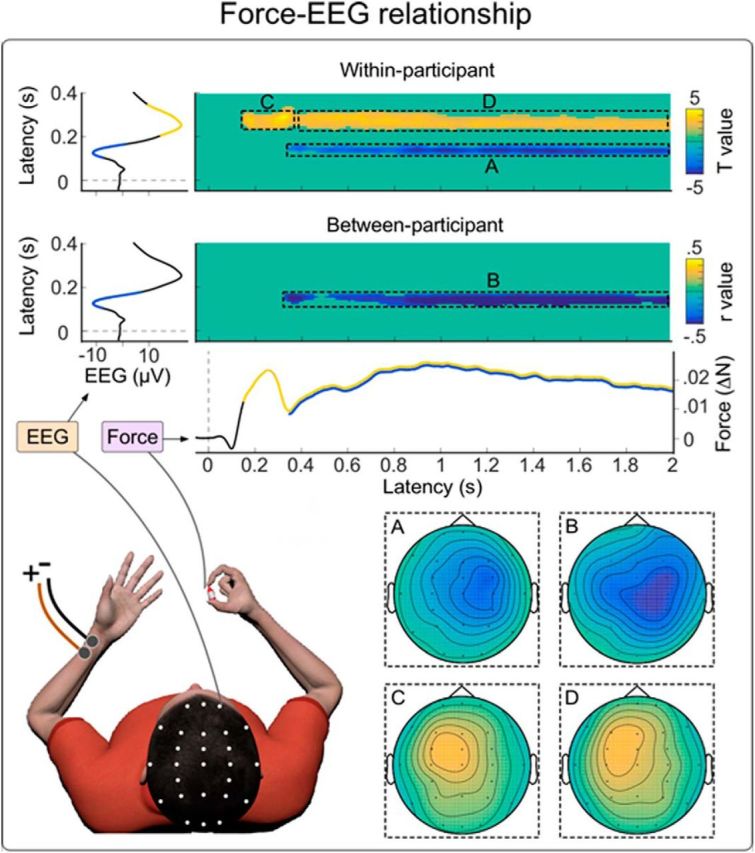
Within- and between-participants relationship between EEG and force signals. Top, Bidimensional plot represents the t values reflecting the significant trial-by-trial correlation (Pearson's r) between EEG and force, for all possible pairs of time points, at electrode Cz. Significant pixels survived a threshold for both temporal consecutivity and spatial adjacency across scalp electrodes (cluster-based permutation testing). This analysis allowed identifying signal changes in one measure (either EEG amplitude or force magnitude) that predict or are predicted by simultaneous, later, or earlier changes in the other measure. EEG and force time courses are shown on the y-axis and the x-axis, respectively. There was a tight relationship between trial-by-trial variability of EEG and force. The EEG time interval 110–180 ms, corresponding to the vertex wave negativity, was negatively correlated with the force variability in the time window ∼300–2000 ms, corresponding to the late force increase. The topography of this cluster (inset A) was lateralized toward the hemisphere contralateral to the stimulated hand (i.e., the hemisphere ipsilateral to the hand exerting the force). The EEG time interval ∼200–370 ms, corresponding to the vertex wave positivity, was positively correlated with the variability in force magnitude in the time window ∼130–2000 ms, which was the period encompassing both the early and the late increases. During the first (C) and second (D) increases, this relationship was strongest at central electrodes, particularly over the hemisphere contralateral to the hand exerting the force (i.e., the hemisphere ipsilateral to the applied stimulus) (insets C, D). Bottom, Bidimensional plot represents the Pearson's r values reflecting the significant between-participant correlation between EEG and force, at electrode Cz. The EEG time interval ∼110–180 ms, corresponding to the vertex wave negativity, was negatively correlated with the variability in force magnitude in the time window ∼300–2000 ms, corresponding to the late force increase. The topography of this cluster (inset B) was lateralized toward the hemisphere contralateral to the stimulated hand (i.e., the hemisphere ipsilateral to the hand exerting the force).