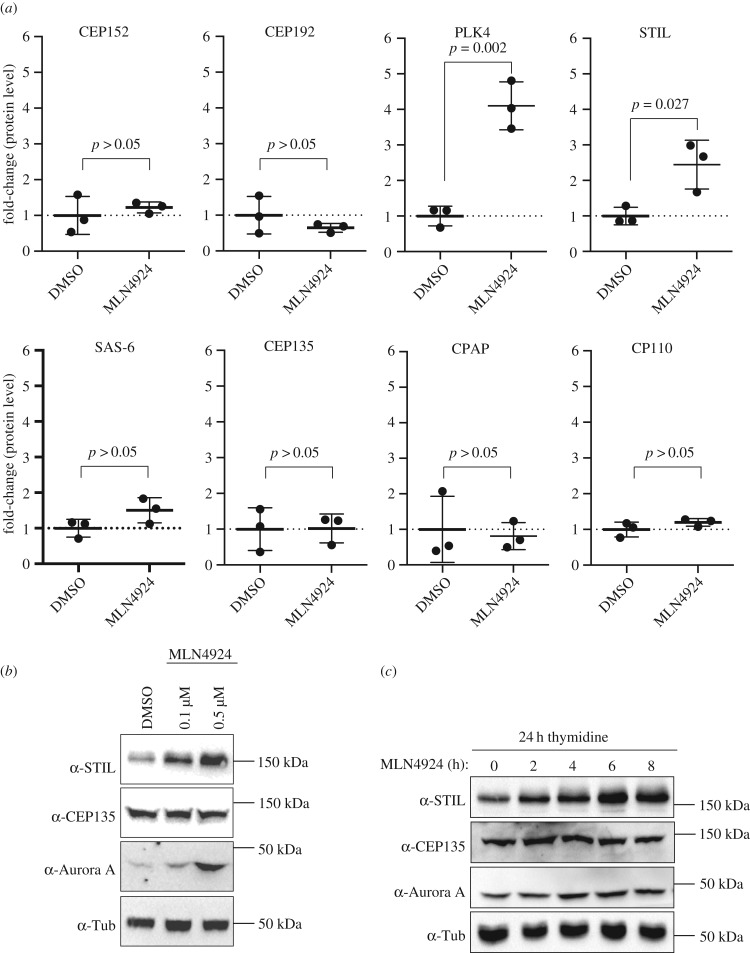
Figure 1.
(a) Scatter plots show relative protein levels of the indicated centriole duplication factors in HEK 293T cells, as determined by PRM mass spectrometry. Cells were treated with either DMSO (control, n = 3) or 0.5 µM MLN4924 (n = 3) for 24 h. To indicate fold-changes in protein levels in response to MLN4924-treatment, the average values measured in DMSO-treated control cells were set to 1.0. Error bars denote s.d., p-values from t-tests (two-tailed, unpaired) are indicated. (b) Western blot analysis shows levels of STIL, CEP135 and Aurora A after 24 h treatment of HEK 293T cells with DMSO (control) or the indicated concentrations of MLN4924. Levels of α-tubulin were analysed for loading control. (c) Western blot analysis shows levels of STIL, CEP135 and Aurora A after treatment of HEK 293T cells with MLN4924 (0.5 µM) for the indicated times (h). Prior to drug addition, cells had been synchronized by a 24 h thymidine treatment. Levels of α-tubulin were analysed for loading control.

