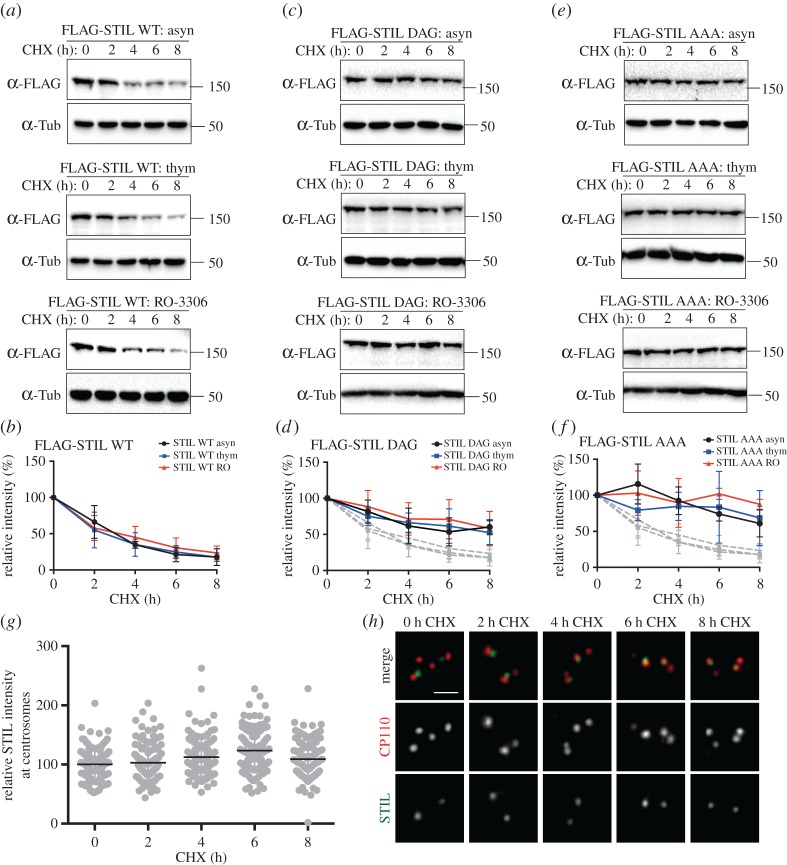
Figure 3.
(a) U2OS cells were transfected with FLAG-STIL WT for a total of 60 h and either left untreated (asyn, upper panel), synchronized in S phase by thymidine treatment (thym, middle panel) or arrested in G2 phase by RO-3306 treatment (RO-3306, lower panel). Cells were subsequently incubated with cycloheximide for a total of 8 h, and samples were taken every 2 h to check for FLAG-STIL protein levels by western blotting with anti-FLAG antibodies. α-tubulin was analysed for loading control. (b) Graph shows quantification of relative FLAG-STIL WT intensity (normalized to time 0), as measured by western blotting in three independent experiments (as described in (a)). Curves for asynchronously growing cells are shown in black (asyn), for S-phase-arrested cells in blue (thym) and for G2-phase-arrested cells in red (RO). (c) The same experiment as described in (a), except that FLAG-STIL DAG was used for transfection. (d) The same analysis as in (b), except that graph shows quantification of relative FLAG-STIL DAG intensity. The grey curves present a repeat of (b), for comparison. (e) The same experiment as described in (a), except that FLAG-STIL AAA was used for transfection. (f) The same analysis as in (b), except that graph shows quantification of relative FLAG-STIL AAA intensity. The grey curves present a repeat of (b), for comparison. (g) U2OS cells were synchronized in S phase (24 h thymidine) before cycloheximide was added for up to 8 h. Cells were fixed every 2 h and stained with antibodies against STIL and CP110 (to identify centrioles). Graph depicts relative STIL intensity at each time point (normalized to time 0), as determined by immunofluorescence microscopy; data are compiled from two independent experiments, resulting in the analysis of 120 centrioles per time point. (h) Representative images of the experiment described in (g). STIL is depicted in green; CP110 in red. Scale bar indicates 1 µm.

