Figure 6.
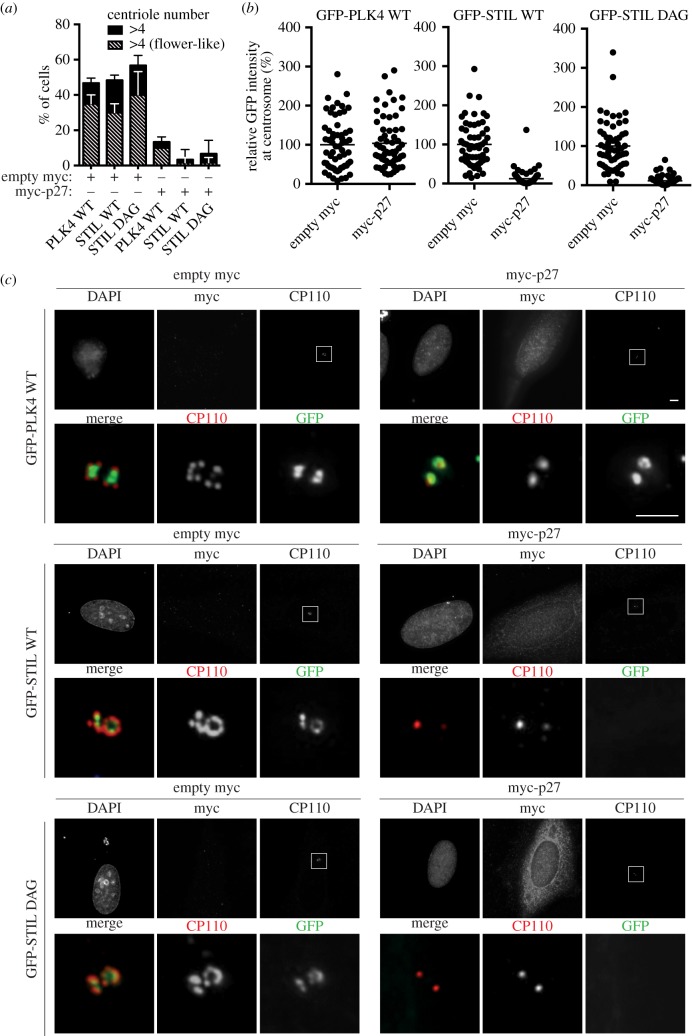
(a) U2OS cells were arrested in S phase with thymidine before being co-transfected for 36 h with the CDK2 inhibitor myc-p27 (or empty myc plasmid for control) and either GFP-PLK4 WT, GPF-STIL WT or GFP-STIL DAG. Cells were fixed and stained with anti-myc and anti-CP110 antibodies, and centrioles were counted by immunofluorescence microscopy, using myc and GFP signals to monitor successful co-transfection. The histogram shows percentages of cells with multiple centrioles (greater than 4, black bars), including the fraction displaying flower-like arrangements (hashed bars). A total of 60 cells were analysed for each condition (compiled from three independent experiments). Error bars denote s.d. (b) The centrosome-associated GFP signals representing GFP-PLK4 WT, GFP-STIL WT and GFP-STIL DAG (as described in (a)) were measured by fluorescence microscopy. Graphs represent the relative GFP intensities as observed after co-transfections of either myc-p27 or empty myc (control). Sixty centrosomes were analysed per condition (compiled from three independent experiments) and normalized to control (average set to 100%). (c) Representative images of the experiment described in (a). Upper panels show overviews of the entire cells, with DAPI, myc and CP110 stainings in grey, and centrosomes (CP110 dots) marked by white boxes. Scale bar indicates 4 µm. Lower panels show 10× magnifications of the boxed centrosomal regions, with CP110 shown in red and GFP in green. Scale bar indicates 2 µm.

