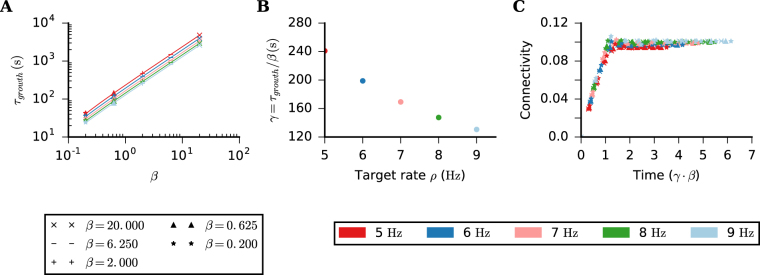
Figure 2.
Time scale of network growth. (A) Time constant of the growth process (defined in text) extracted from Fig. 1B plotted against β, for different values of ρ. This plot summarizes the result of 25 simulation runs, using 5 different values of β and 5 different values of ρ. In each simulation, all excitatory neurons have the same parameters ρ and β, for both presynaptic and postsynaptic elements. (B) Gain γ = τgrowth/β plotted against ρ. (C) Time evolution of the average EE connectivity of the 25 simulation runs in (A), rescaled by τgrowth.

