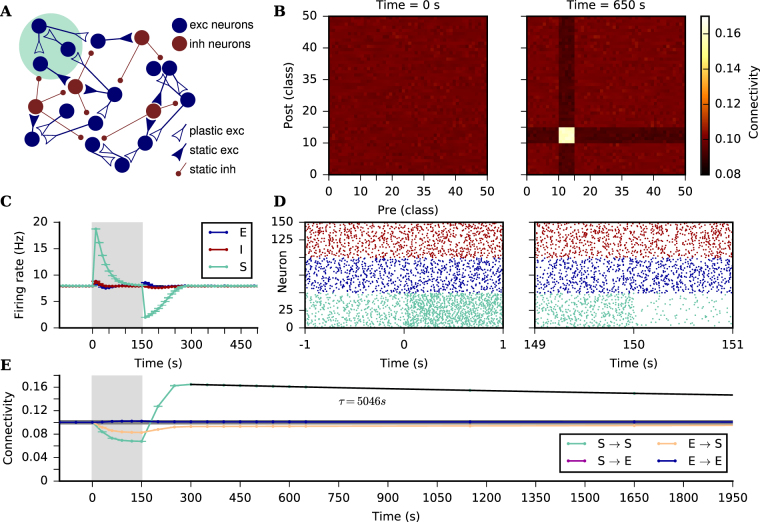
Figure 3.
Associative properties of the SP rule. (A) A recurrent network of excitatory and inhibitory neurons is grown from scratch (see text for details). After it has reached a statistical equilibrium of connectivity, a subgroup (S) comprising 10% of the excitatory neurons is stimulated with a strong external input for 150 s. All the other excitatory (E) and inhibitory (I) neurons in the network are still stimulated with the same external input as during the growth phase. (B) Connectivity matrix before specific stimulation (left), and after specific stimulation has been off for 500 s (right). Neurons are divided into 50 equally large classes and colors correspond to average connectivity between classes. Neurons are sorted such that classes 10 to 15 comprise neurons belonging to the stimulated subgroup. (C) The S neurons (green), E neurons (blue), and I neurons (red) change their firing rates due to a change in external input, but also due to the induced changes in connectivity. As the firing rates of excitatory neurons are subject to individual homeostatic control, they are all back to normal after another 150 s once the extra stimulus is turned off. Dots and bars indicate mean ± standard deviation across 10 independent simulation runs. Highest standard deviation in the time series is 0.09 Hz. (D) Raster plot for 50 neurons randomly chosen from S, 50 from E, and 50 from I. Shown are 2 s before and after specific stimulation starts (left) and 2 s before and after specific stimulation ends (right). (E) Average connectivity within the stimulated subgroup (green), among excitatory neurons not belonging to the subgroup (blue), as well as across populations from non-stimulated excitatory neurons to the stimulated subgroup (orange) and from the stimulated subgroup to non-stimulated excitatory neurons (purple). Dots and bars indicate mean ± standard deviation across 10 independent simulation runs. Highest standard deviation in the time series is 5 × 10⁻⁴. The grey horizontal line indicates the average connectivity right before specific stimulation starts. The black line is an exponential fit to the subgroup to subgroup connectivity, from which the time constant τ was extracted. The structural association among jointly stimulated neurons induced by stimulation persists for a very long time. Grey boxes in (C) and (E) indicate the time when external input to the stimulated subgroup is on.

