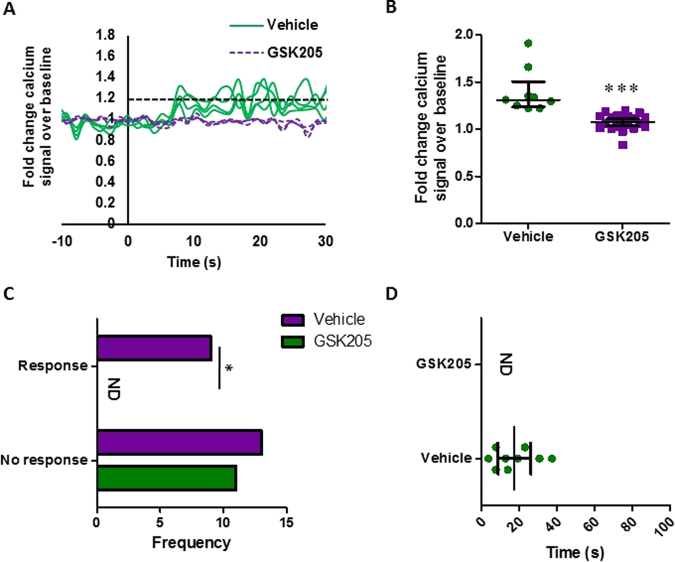
Figure 3.
(A) Representative calcium profile of individual MSCs responding to OFS generating 1 Pa, 1 Hz. OFS begins at t = 0 s. Cells treated with vehicle alone, DMSO, represented in the solid green; those treated for 1 hour pre mechanical stimulation with 10 µM GSK205 are in the purple dashed line. Baseline values calculated from the 20 seconds prior to the application of OFS. The dashed black line at 1.2-fold change marks the value above which cells are considered to be responsive. (B) Median ± Interquartile range fold increase in calcium at first peak following application of treatment. Vehicle: N = 4, n = 9; GSK205: N = 4, n = 22, Mann Whitney test, ***p < 0.001. (C) Frequency of cells responding to the stimulus. Median ± Interquartile: Vehicle: N = 4, n = 22; GSK205: N = 4, n = 11, Fisher’s exact test, *p < 0.05. (D) Time to first peak for individual cells following application of stimulus at time 0 s. Bars mark Median ± Interquartile, Vehicle: N = 4, n = 9; GSK205: N = 4, n = 22 ND = None determined, no responsive cells observed.

