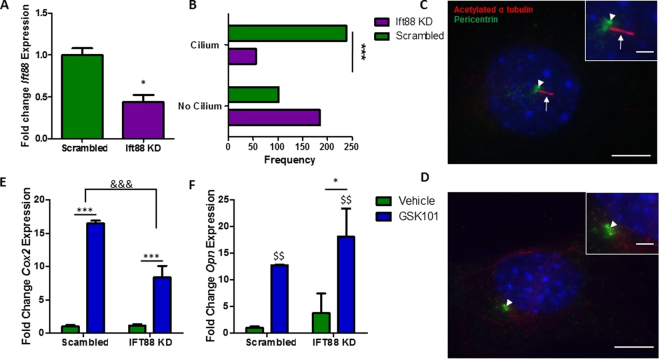
Figure 7.
(A) Validation of inhibition of Ift88 gene expression, N = 4, student’s t-test with Welch’s correction, *p < 0.05. (B) Frequency of primary cilium formation following transfection with siRNA, N = 4–6, n = 286–293, Fisher’s exact test, ***p < 0.001. (C,D) Immunostaining of cells transfected with either off target control (C) or Ift88 targeted siRNA (D) stained with acetylated α-tubulin, (primary cilium, red; arrows) and pericentrin (centrioles, green; arrow head). Nuclei are counterstained with DAPI (blue). Scale bars represent 5μm and 1μm (insert). (E) Cox2 and (F) Opn gene expression in MSCs transfected with siRNA targeting Ift88 or scrambled control, following 2 hours of treatment with 10 nM GSK101 or vehicle control, represented as Mean ± SEM, N = 3, n = 5–8, 2 way ANOVA with Bonferroni post-test, *p < 0.05, ***p < 0.001 significant in comparison to vehicle control, $$p < 0.01 significant effect of GSK101 treatment, &&&p < 0.001 significant effect of the treatment on the response to GSK101.

