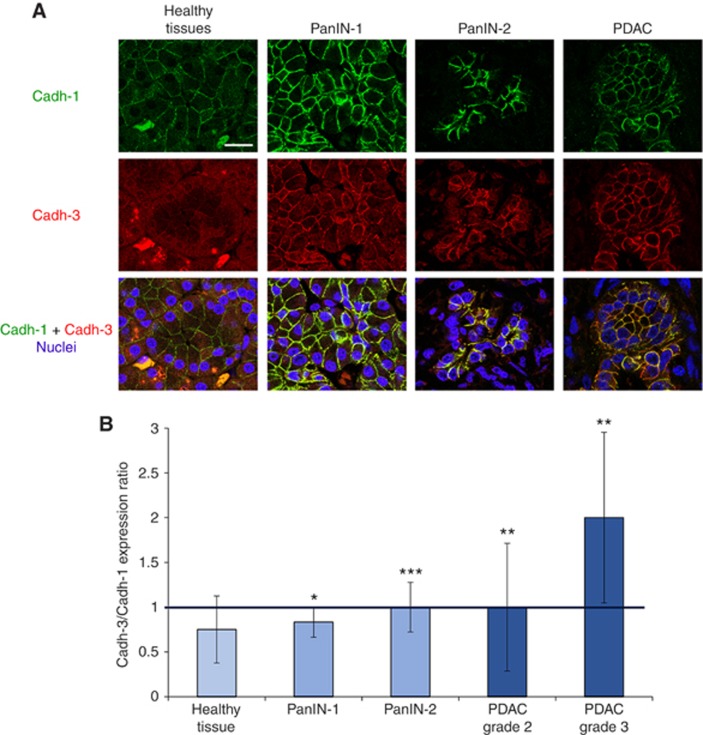
Figure 1.
Cadherin-1 and cadherin-3 expression during PDAC progression. (A) Sections of human pancreatic tissue samples were sequentially stained with mouse anti-cadherin-1 and rabbit anti-cadherin-3 Abs. Tissues were then incubated with Alexa 488-conjugated goat anti-mouse and Alexa 594-conjugated Abs and were observed with a confocal microscope. Cell nuclei were stained with Draq5. Scale bar: 25 μm. (B) Pancreas adenocarcinoma and pancreatic intraepithelial neoplasia (PanIN) tissue microarrays, as well as cancer tissue array were immunostained and observed as described in (A). Cadherin-1 and cadherin-3 staining were scored as described in Materials and Methods. Results are expressed as cadherin-3 vs cadherin-1 expression ratio. *P<0.05, **P<0.01, ***P<0.001.

