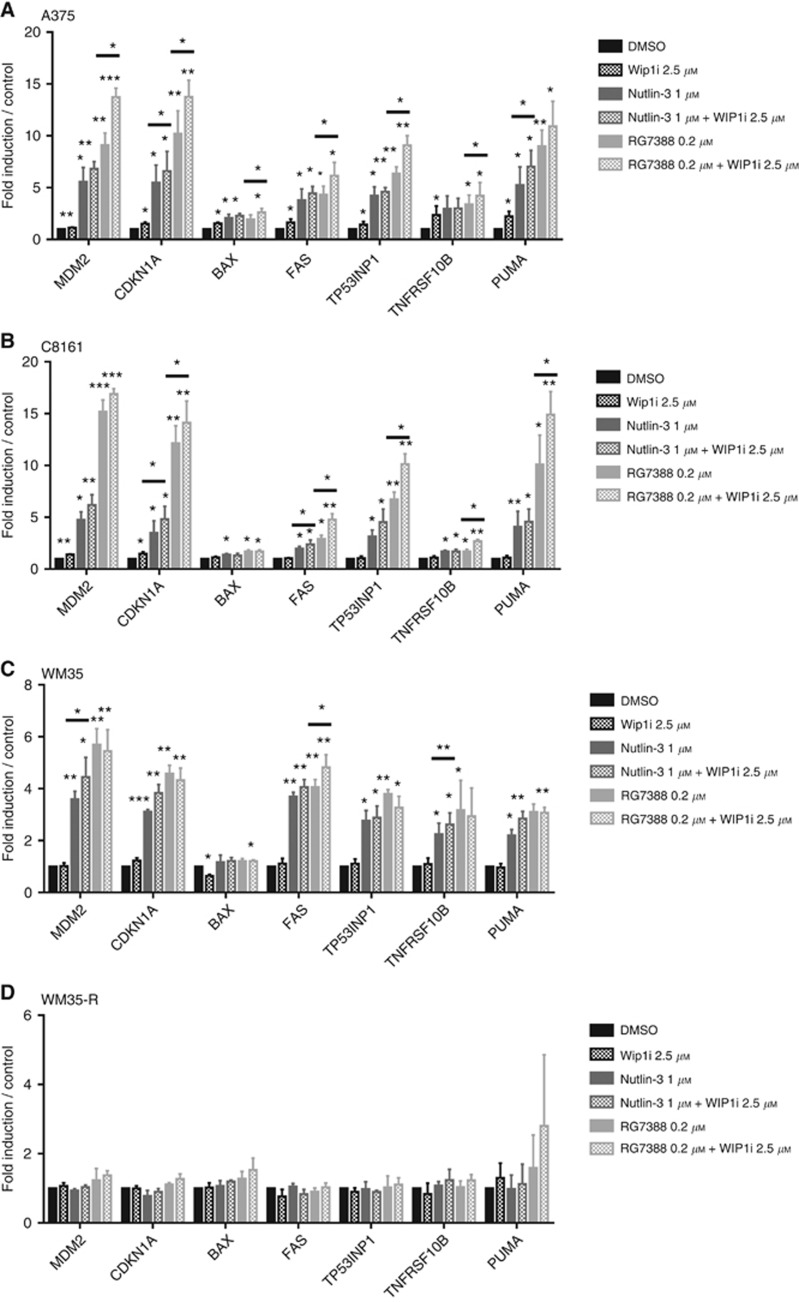
Figure 5.
The mRNA expression of p53 transcriptional target genes by qRT–PCR. The mRNA expression of p53 transcriptionally regulated genes in response to either 2.5 μM WIP1i, 1 μM Nutlin-3, 0.2 μM RG7388 or combinations for 6 h relative to DMSO solvent and GAPDH control in A375 (A), C8161 (B), WM35 (C) and WM35-R (D) melanoma cells. Statistical significance of differences (*P<0.05, **P<0.005, ***P<0.0005) is shown above each bar for each treatment compared with DMSO control. The significance of differences with or without WIP1i are indicated above the horizontal bars. Only the P-values of <0.05 are shown. Data are presented as mean±s.e.m. for three independent repeats.

