Figure 5.
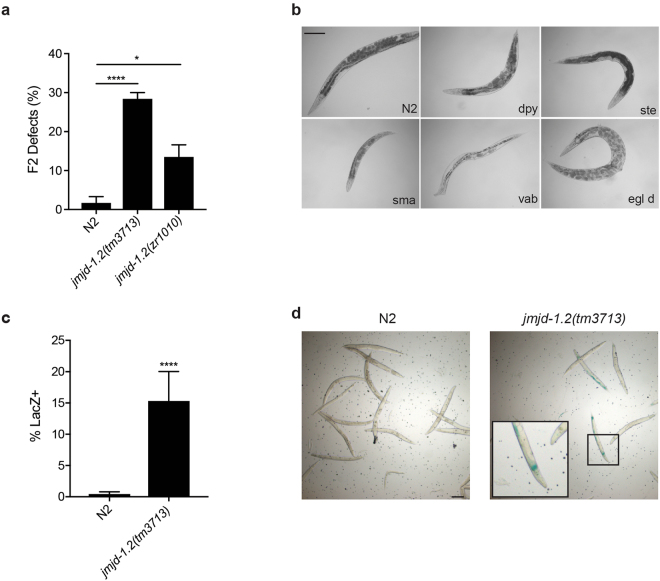
jmjd-1.2 mutants have increased mutational rate after HU. (a) Quantification of the percentage of abnormalities identified in F2 progeny derived from animals of indicated genotypes exposed to HU (25 mM, 16 h). The percentage of F2 abnormalities was determined based on the number of plates that had at least one F2 abnormal animal. (b) Representative images of jmjd-1.2 F2 progeny derived from animals exposed to HU (25 mM, 16 h). Dpy, dumpy; ste, sterile; sma, small; vab, organism morphology variant; egl d, egg laying defective. A wild-type animal (N2) is shown, for comparison. (c) Quantification of the percentage of lacZ- positive animals in F1 generation after parental HU treatment (25 mM, 16 h). N2 and jmjd-1.2(tm3713) carrying the pkIs1604 transgene are used. (d) Representative images of the F1 generation after parental HU treatment, (25 mM, 16 h) stained by X-gal. N2 and jmjd-1.2(tm3713), carrying the pkIs1604 transgene are shown. A magnification of a lacZ-positive animal is shown. In a and c, the graphics show the average of two independent experiments and data are presented as mean +/− SD. *p ≤ 0.05, ****p ≤ 0.0001, with chi square test. Scale bars, 100 μm.

