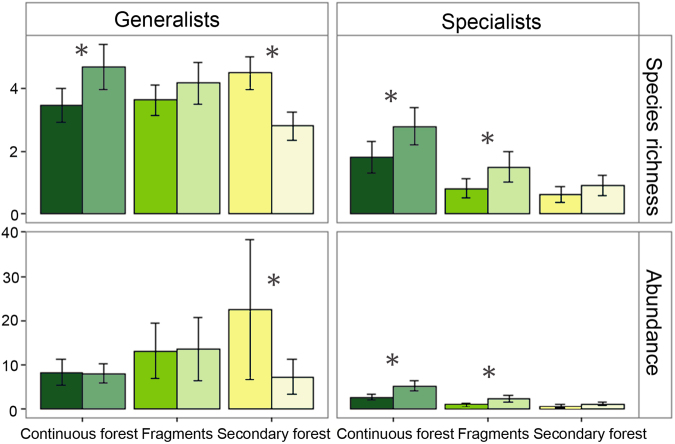
Figure 2.
Bat species richness and abundance of generalist and specialist bats in continuous forest, fragments and secondary forest, ~15 years (dark-coloured bars) and ~30 years (lighter-coloured bars) after experimental forest clearance. Plotted are the predictions of the mean number of species and the mean number of individuals ( ± posterior standard deviation) captured per survey visit. Capture effort was standardized within each habitat category and thus the results are comparable only between periods but not across habitat types. Asterisks stand for high statistical support (posterior probability > 95%) for the predictions being higher or lower ~30 years after experimental forest clearance (2011–2013) than ~15 years after experimental forest clearance (1996–2002). Species’ habitat affinities are reported in Table S1 (for classification description see Methods) and results for all species combined are provided in Supplementary Fig. S1.

