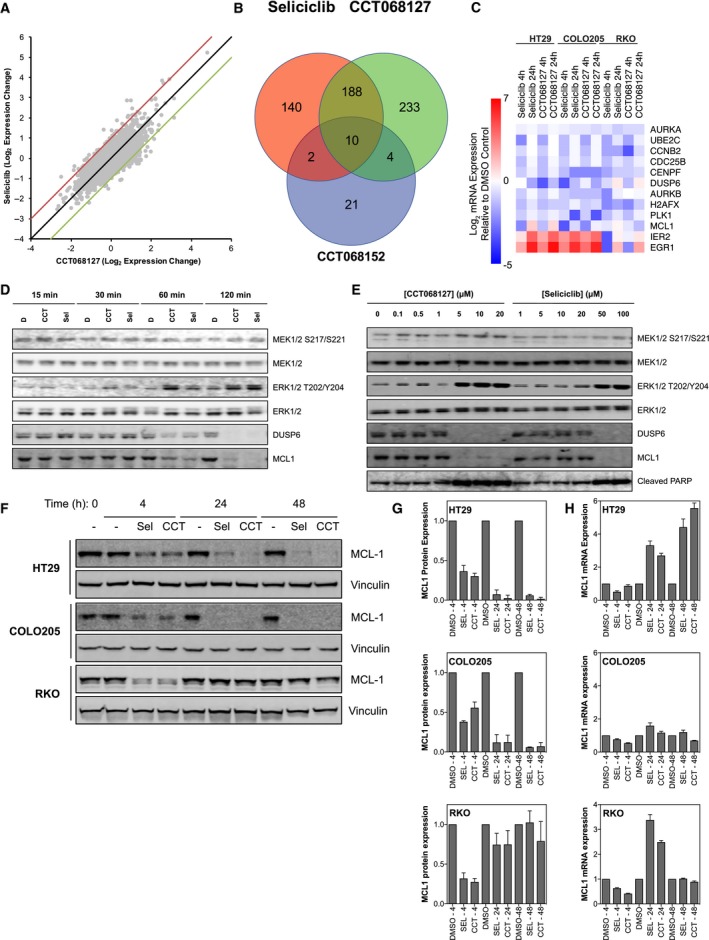
Figure 4.

Gene expression analysis of colon cancer cells following treatment with CCT068127 and seliciclib. (A) HT29 cells were treated with equiactive concentrations (3xGI 50, SRB assay) of seliciclib (45 μm) and CCT068127 (2.55 μm) or 45 μm CCT068152. mRNA expression profiles were generated using a custom microarray enriched for 5808 cDNAs implicated in cancer. Genes that were differentially expressed between the CDK inhibitor‐ and the DMSO‐treated cells were determined using comparative marker selection (t‐test) and a ≥ twofold change in expression as a filter. The mRNA expression changes for seliciclib and CCT068127 were plotted against each other. (B) Venn diagram was constructed to show the number of genes in common between the two CDK inhibitors, and the inactive analog CCT068152, which displayed either increased or decreased expression following treatment. (C) mRNA expression changes following treatment of HT29, COLO205, or RKO human colon cancer cells with 3xGI 50 concentrations of CCT068127 or seliciclib for 4 and 24 h as determined by RT‐qPCR. (D) HT29 cells were treated with 5xGI 50 concentrations of CCT068127 (4.25 μm) or seliciclib (75 μm) for 15, 30, 60, or 120 minutes and cell lysates analyzed for the indicated proteins by western blotting. (E) HT29 cells were treated with a range of concentrations of CCT068127 or seliciclib for 24 h. Cells were lysed and extracts were analyzed by western blotting for the proteins listed. (F) HT29, COLO205, and RKO cells were treated with either DMSO or 3xGI 50 concentrations of CCT068127 or seliciclib for 4, 24, and 48 h and protein lysates analyzed by western blotting for the indicated proteins. Data are representative of three independent repeats. (G) The expression of MCL1 in (F) was quantified and normalized to vinculin expression. Data are the mean of three independent repeats ± SE. (H) Cells were treated as in (F) and the expression of MCL1 mRNA was quantified by qRT‐PCR, normalized to the housekeeping gene GUSB. The mean ± SE of triplicate measurements is presented.
