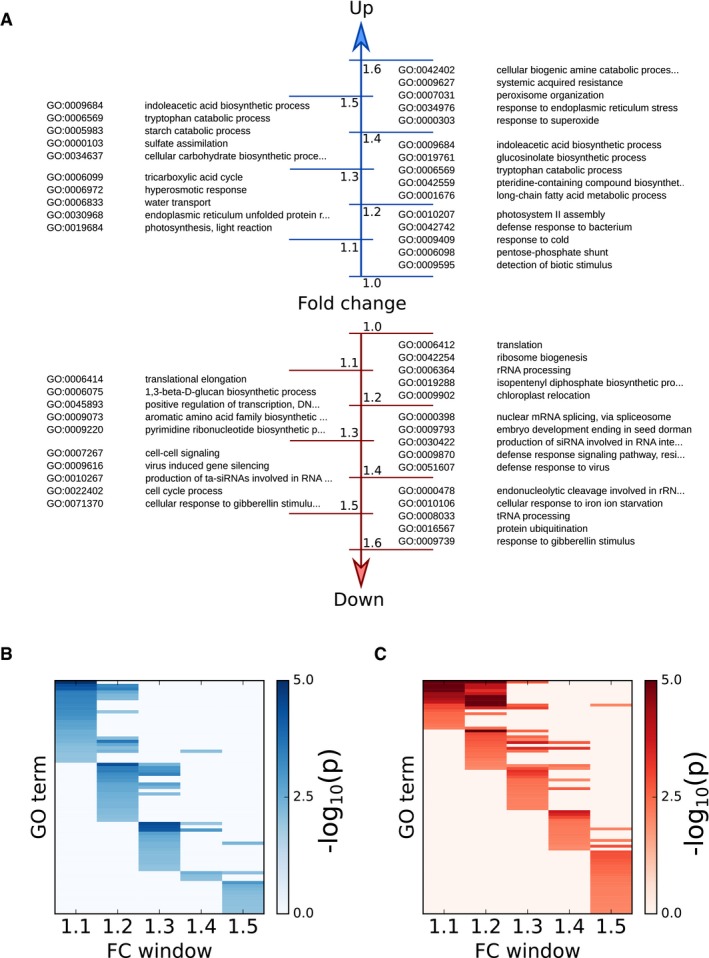
Figure 2. Enrichment of GO terms in fold change (FC) windows for proteins up‐ and down‐regulated with increasing photoperiod.

- Five high‐scoring GO enrichments of proteins are listed for each FC window.
- Heatmap of GO enrichments for each FC window for significantly up‐regulated proteins (enrichment scored by −log10(P‐value) of Fisher's exact test). Only GO enrichments in FC windows up to 1.5 are shown. Complete enrichments across all FC windows are provided in Table EV5.
- As in (B), for significantly down‐regulated proteins.
