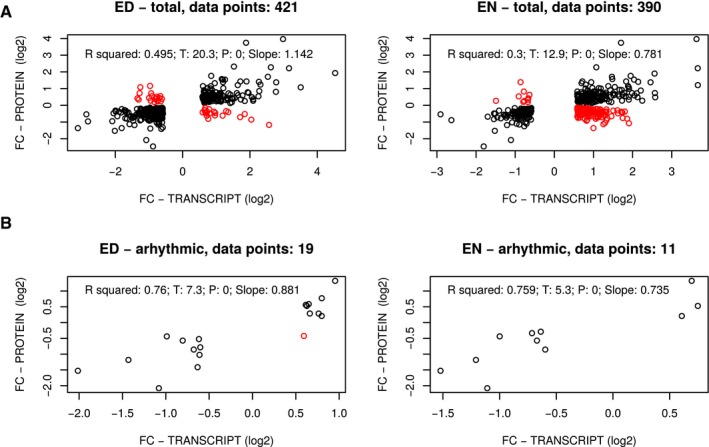
Correlations between the photoperiod proteome data and transcripts identified as exhibiting significant changes across photoperiods. Fold changes across photoperiods in transcripts and proteins are compared. Changing transcripts were identified at both ED and EN time‐points (left‐ and right‐hand panels, respectively), as described in Flis
et al (
2016). Fold changes are defined as the maximal fold change measured across photoperiods (
Table EV3). Black dots indicate the direction of change was the same for both transcripts and proteins; red dots indicate the direction of change was different for transcripts and proteins. Transcript data are from samples taken from the same plants as were used for our proteomic analysis and were described in Flis
et al (
2016). The total number of transcript:protein pairs is given in the title of each graph.

