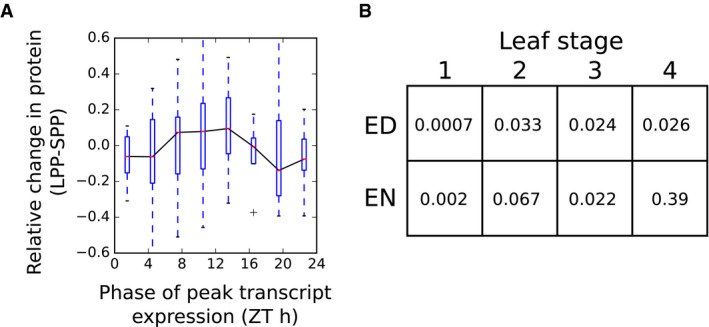
Figure EV3. Protein response to photoperiod in an independent dataset.

- Changes in protein levels between 8 h (SPP) and 16 h (LPP) photoperiods, as measured in Baerenfaller et al (2015), grouped according to the phase of peak transcript expression. Boxes span the interquartile range. Whiskers span 1.5 times the interquartile range.
- P‐values of differences in protein levels for proteins across for leaf development stages (Baerenfaller et al, 2015) with evening‐phased (ZT10 to ZT14, inclusive) and dawn‐phased (ZT22 to ZT2, inclusive) transcripts (Bläsing et al, 2005), as calculated by Mann–Whitney U‐test (note that in all cases the mean of the change from SPP to LPP was higher for the evening‐phased group than the dawn‐phased groups, as expected).
