
Figure 1.
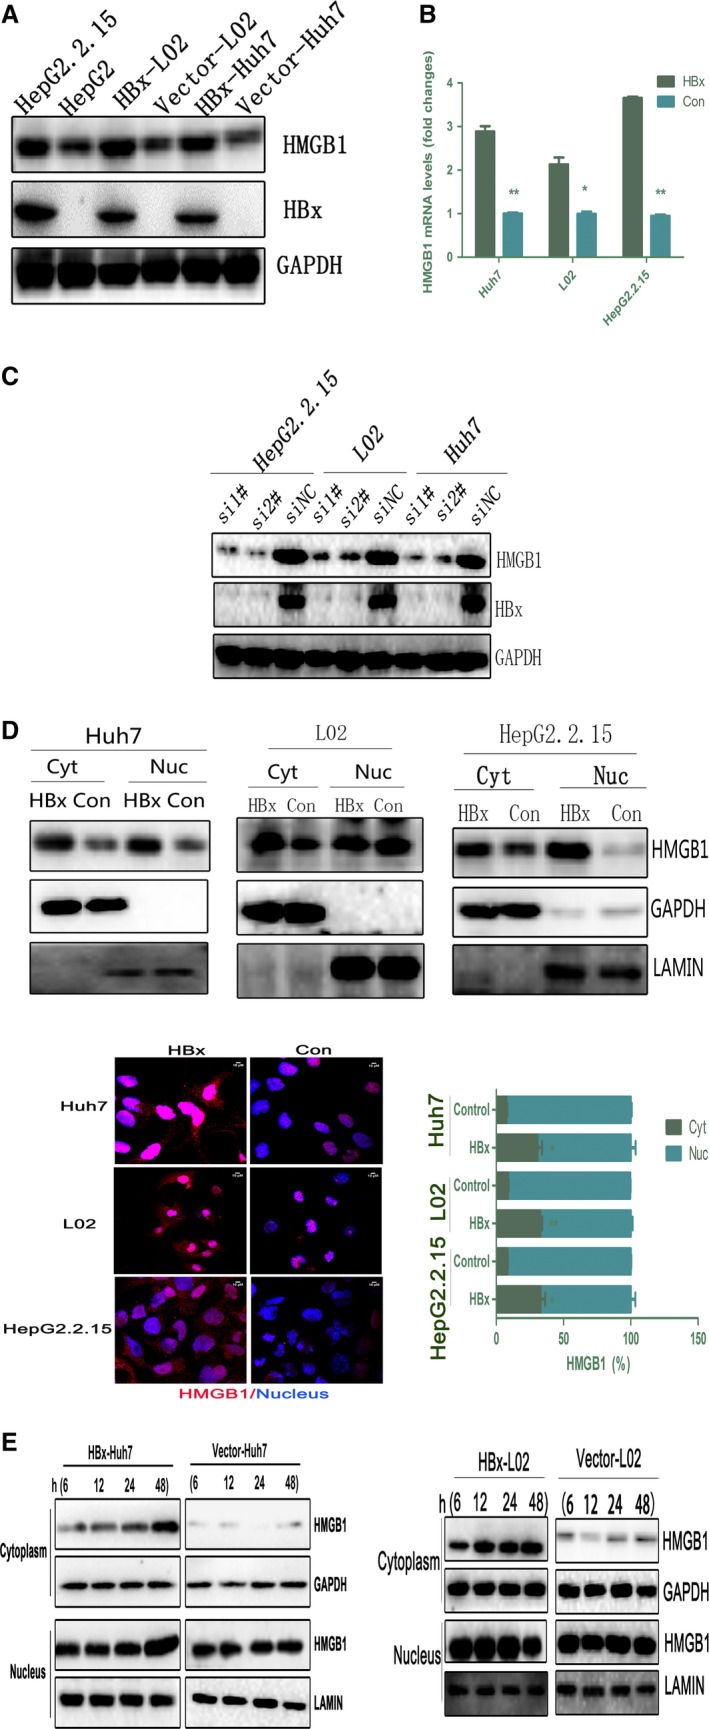
HBx upregulates HMGB1 expression and promotes its Cyt translocation. (A,B) HMGB1 expression levels in HepG2.2.15, HBx‐Huh7, and HBx‐L02 cells were analyzed by immunoblot and RT‐PCR. *P < 0.05, **P < 0.01 compared with empty vector, n = 3. (C) The indicated cells were pretreated with HBx‐specific siRNA for 72 h and immunoblotted with an HMGB1‐specific antibody. (D) Nuclear/Cyt HMGB1 expression in cells stably transfected with HBx (HBx‐Huh7, HBx‐L02, and HepG2.2.15) was analyzed by immunoblot and immunofluorescence. LAMIN was used as a nuclear fraction control, and GAPDH was used as a Cyt fraction control. The mean nuclear (Nuc) and Cyt HMGB1 intensity per cell was determined by immunofluorescence. *P < 0.05, **P < 0.01 versus the empty vector (Control) group; n = 3. Representative images are depicted on the left, HMGB1 (red) and DAPI (blue). Scale bar, 10 μm. (E) Immunoblot analysis of nuclear/Cyt HMGB1 expression in cells (Huh7 and L02) transiently transfected with HBx (3 μg) for the indicated time periods (6, 12, 24, and 48 h).