Figure 1.
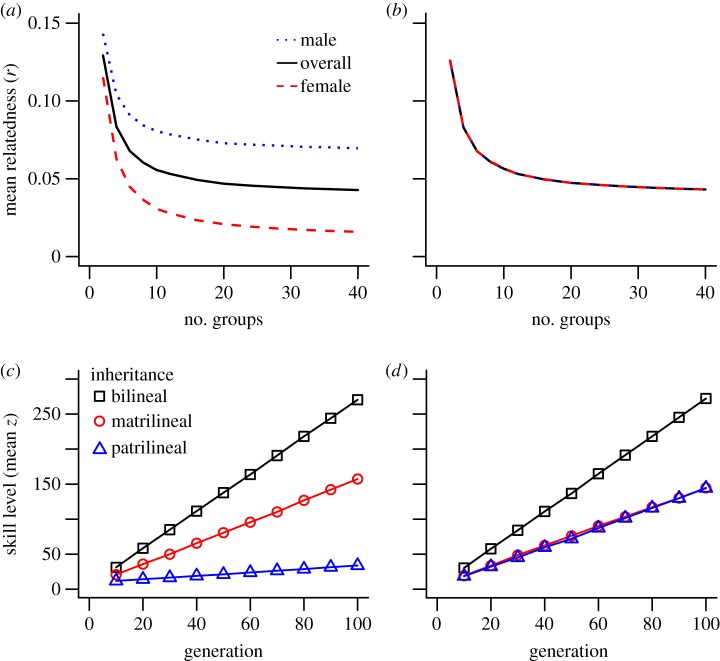
Effect of dispersal on group relatedness and rate of cultural evolution. Mean coefficient of relatedness (r) to the group for males (dotted blue), females (dashed red) and overall (solid black) under (a) patrilocal dispersal and (b) bilocal dispersal after 100 generations of the model. Accumulation of cultural skills transmitted bilineally (squares), matrilineally (circles), patrilineally (triangles) under (c) patrilocal dispersal and (d) bilocal dispersal. All points are the mean of 200 simulations with α = 3 and β = 1.5. Maximum standard deviation of any point is ±0.017 in (a,b) and ±11.97 in (c,d). (Online version in colour.)

