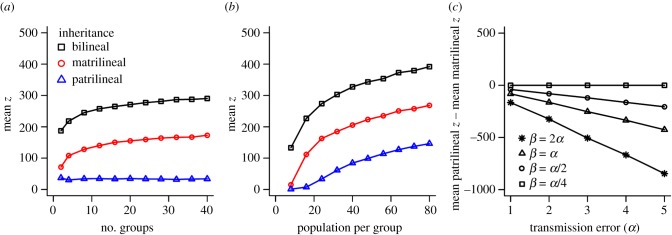
Figure 2.
Dynamics of cultural transmission across parameter space given patrilocality. (a) Mean skills levels (z) after 100 generations across varying number of groups of 24 individuals. (b) Mean skill levels (z) after 100 generations across 20 groups of varying size. (c) The difference between mean patrilineal and matrilineal skill levels (z) after 100 generations across a range of values of α and β, with lines linking the values of β relative to α. In all panels, points are the average of 30 simulations. Maximum standard deviation of any point is ±17.85 in (a), ±15.28 in (b) and ±89.05 in (c). (Online version in colour.)

