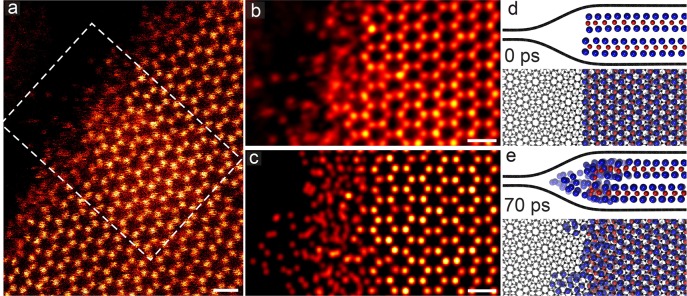
Figure 7.
Edge structure of encapsulated bilayer MoTe2. (a) STEM-HAADF image showing the edge of graphene-encapsulated bilayer MoTe2. The image displays raw data in false color. (b) A close-up of the region indicated by the white dashed line in panel a. The image has been treated by a Gaussian blur with a radius of 4 px. (c) Simulated snapshot of graphene-encapsulated bilayer MoTe2 after 70 ps at 300 K. The scale bars are 0.5 nm. (d, e) Side and top views of the model structure at the beginning of the simulation and after 70 ps at 300 K.

