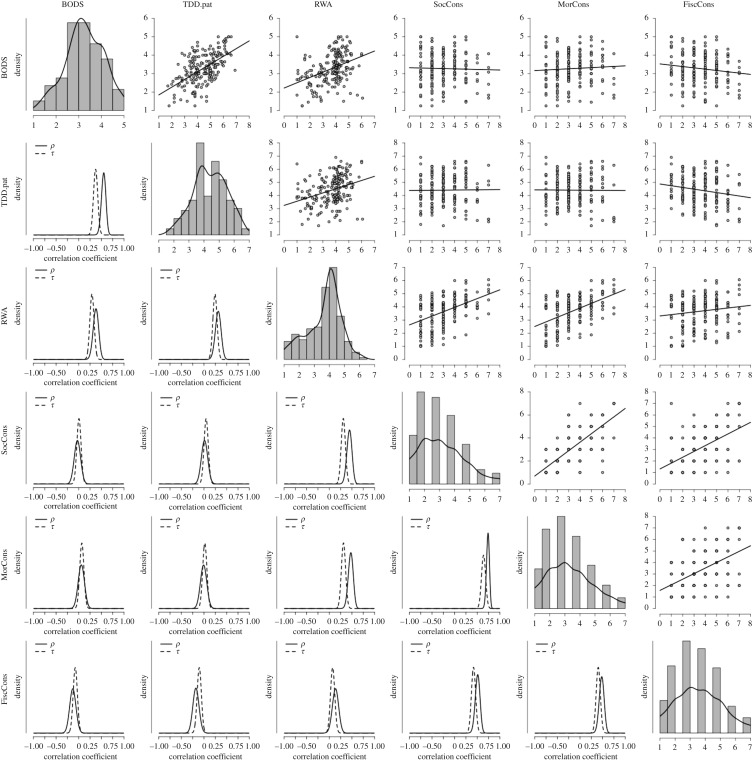
Figure 1.
Correlation matrix for Study 1 data. On the top right are displayed the scatterplots and regression fit lines for the relationships among the variables measured in Study 1. Along the diagonal are displayed the histograms and density plots for each of the variables. On the bottom left are displayed the posterior distributions for the parameters ρ and τ under the alternative hypothesis using a β prior of width = 0.5. BODS, body odour disgust scale; TDD.pat, pathogen subscale of the three domains of disgust; RWA, right wing authoritarianism; SocCons, social conservatism; MorCons, moral conservatism; FiscCons, fiscal conservatism.

