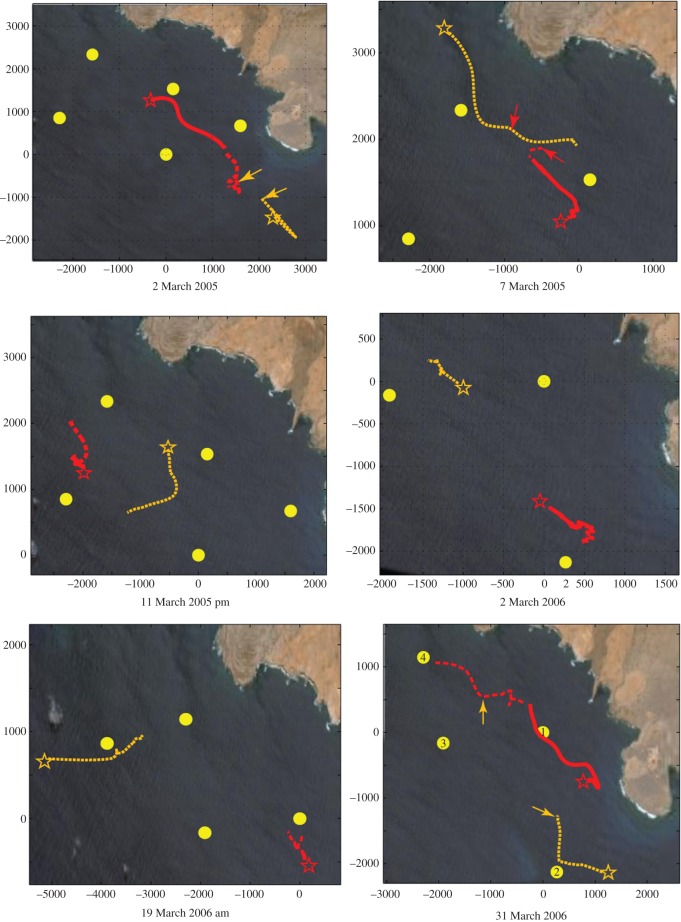
Figure 3.
Six examples of interpolated tracks of singer movements generated from acoustic locations calculated every 2.5 min or more. Recording units are indicated by yellow circles. Focal singers are in red, the solid line indicates the singer's track in the BEFORE period, the dotted line indicates his track in the DURING period. Second singers are in orange. Stars represent the initial position for each singer. In three cases, one singer quit singing in the DURING period; the position of each singer at the time when one quit is indicated by the arrows, and the colour of the arrow indicates which singer quit singing. The x and y axes indicate meters from the center of the array.

