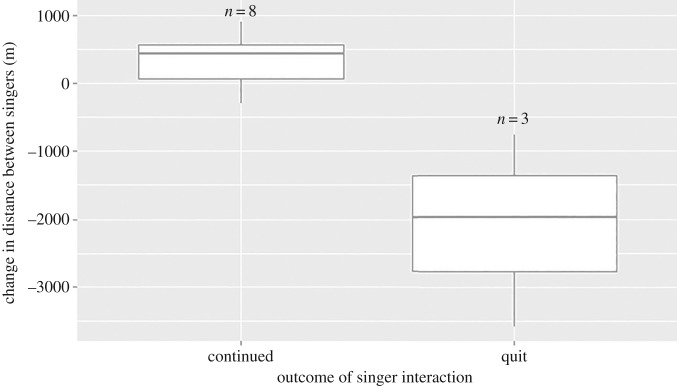
Figure 5.
Box plot of the change in distance between the focal and second singers during the 45 min analysis period, grouped by whether both males continued singing throughout the analysis (n = 8), or whether one male quit singing (n = 3). The mean change in distance between members of dyads in which both males continued to sing was 336 ± 443.3 m, while the mean change in distance between dyad members when one singer quit singing was −2101.7 ± 1410.69 m, where negative indicates that the distance between singers decreased. The change in distance was significantly different between the two categories (Mann–Whitney: z = −2.18, p = 0.0293).

