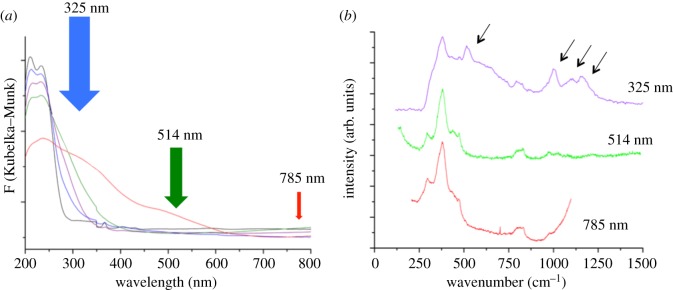
Figure 19.
(a) Absorption spectra of various Fe-containing zeolites with heterogeneous active-site distributions, indicating the excitation lines that can be used to induce Raman scattering. (b) Raman spectra of Fe-containing zeolite collected at different excitation lines. Only by coinciding the excitation wavelength with the absorbing sites of the catalyst can detailed Raman bands of the active sites be observed (arrowed on the spectrum). Reproduced with permission from Hammond et al. [93].

