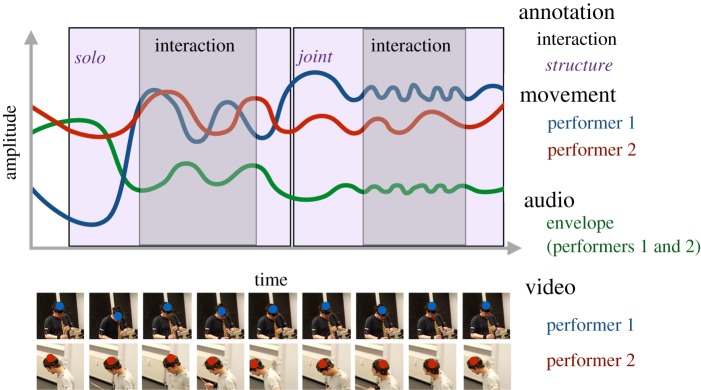
Figure 2.
Example visualization of the data (video, annotation, movement (combined x and y) and audio). The blocks display the manual annotations (two bouts of interaction are shown in grey and musical structure is denoted in purple). The red and blue lines display the raw amplitude of the movements for two performers. These are the radial coordinates of the x- and y-coordinate positions obtained from the optical flow analyses of the videos, with the video ROIs and the detected centres of the movement shown in the lower pane. The green line represents the amplitude of the audio envelope.

