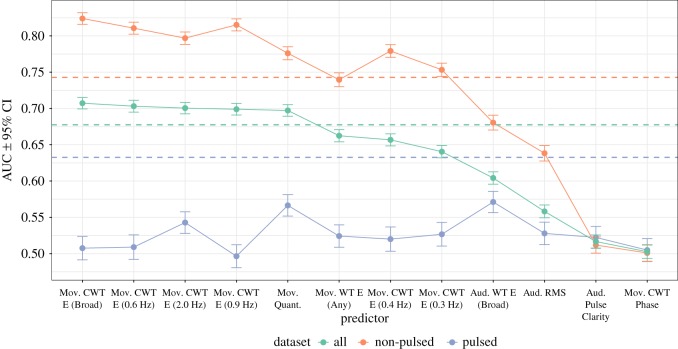
Figure 7.
Prediction rates of bouts of interaction for each predictor across and over the datasets. Mov. denotes movement predictors and Aud. denotes audio predictors (see table 2 for details). CWT denotes cross-wavelet transform, WT denotes wavelet transform and E denotes Energy. Dotted horizontal lines indicate the baseline-level prediction for each dataset.

