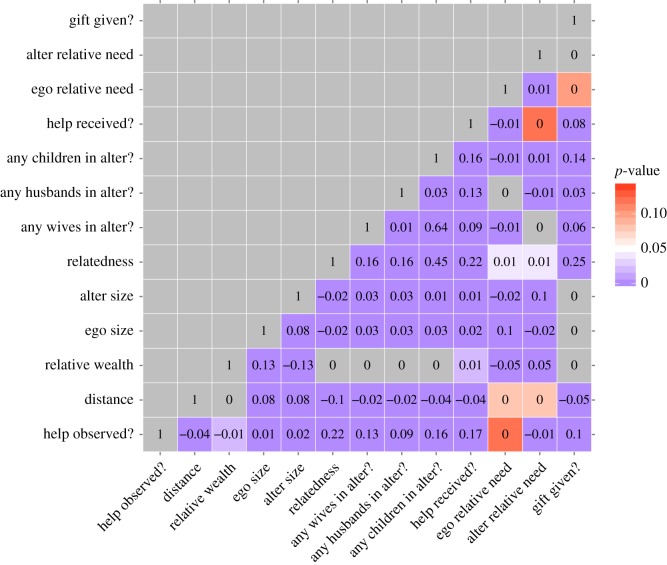
Figure 2.
Bivariate correlations between predictor variables and the response variable (help observed). Numbers within the cells are Pearson's correlation coefficients. Blue cells are statistically significant (p < 0.05), with darker shades as p approaches zero; white cells are borderline statistically significant; red and grey cells are not statistically significant.

