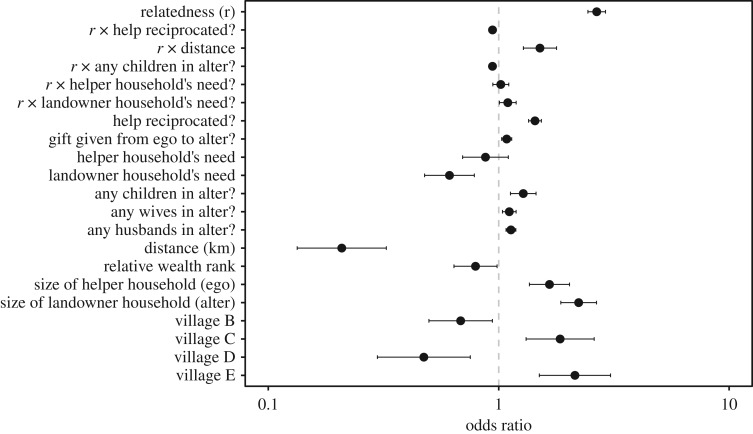
Figure 3.
Odds ratios from the best-fitting generalized estimating equation predicting farm labour (table 4). Estimates were standardized over 2 s.d. to allow comparison between continuous and binary predictors [56]. Error bars are 95% confidence intervals. Intercept (OR = 0.002 [0.001, 0.002]) not shown for clarity.

